
sharp vision traders
Enhancing Your Trading Experience

Woodies Pivots (NT)
- Categories: Indicator, NinjaTrader
- Tags: Pivots
- Type: Free
Woodies Pivot for NinjaTrader are calculated using a specific formula that gives more weight to the opening price of the current trading period.
Note: This download requires NinjaTrader 8 release 8.1.3 or newer.
Understanding Woodies Pivot
Woodies Pivot Points for NinjaTrader are calculated using a specific formula that gives more weight to the opening price of the current trading period. This approach differs from traditional pivot points, which typically use the previous period's high, low, and close prices.
Key Features of Woodies Pivot:
- Emphasis on Current Open Price: Woodies method places significant importance on the opening price, making it more responsive to the current market sentiment.
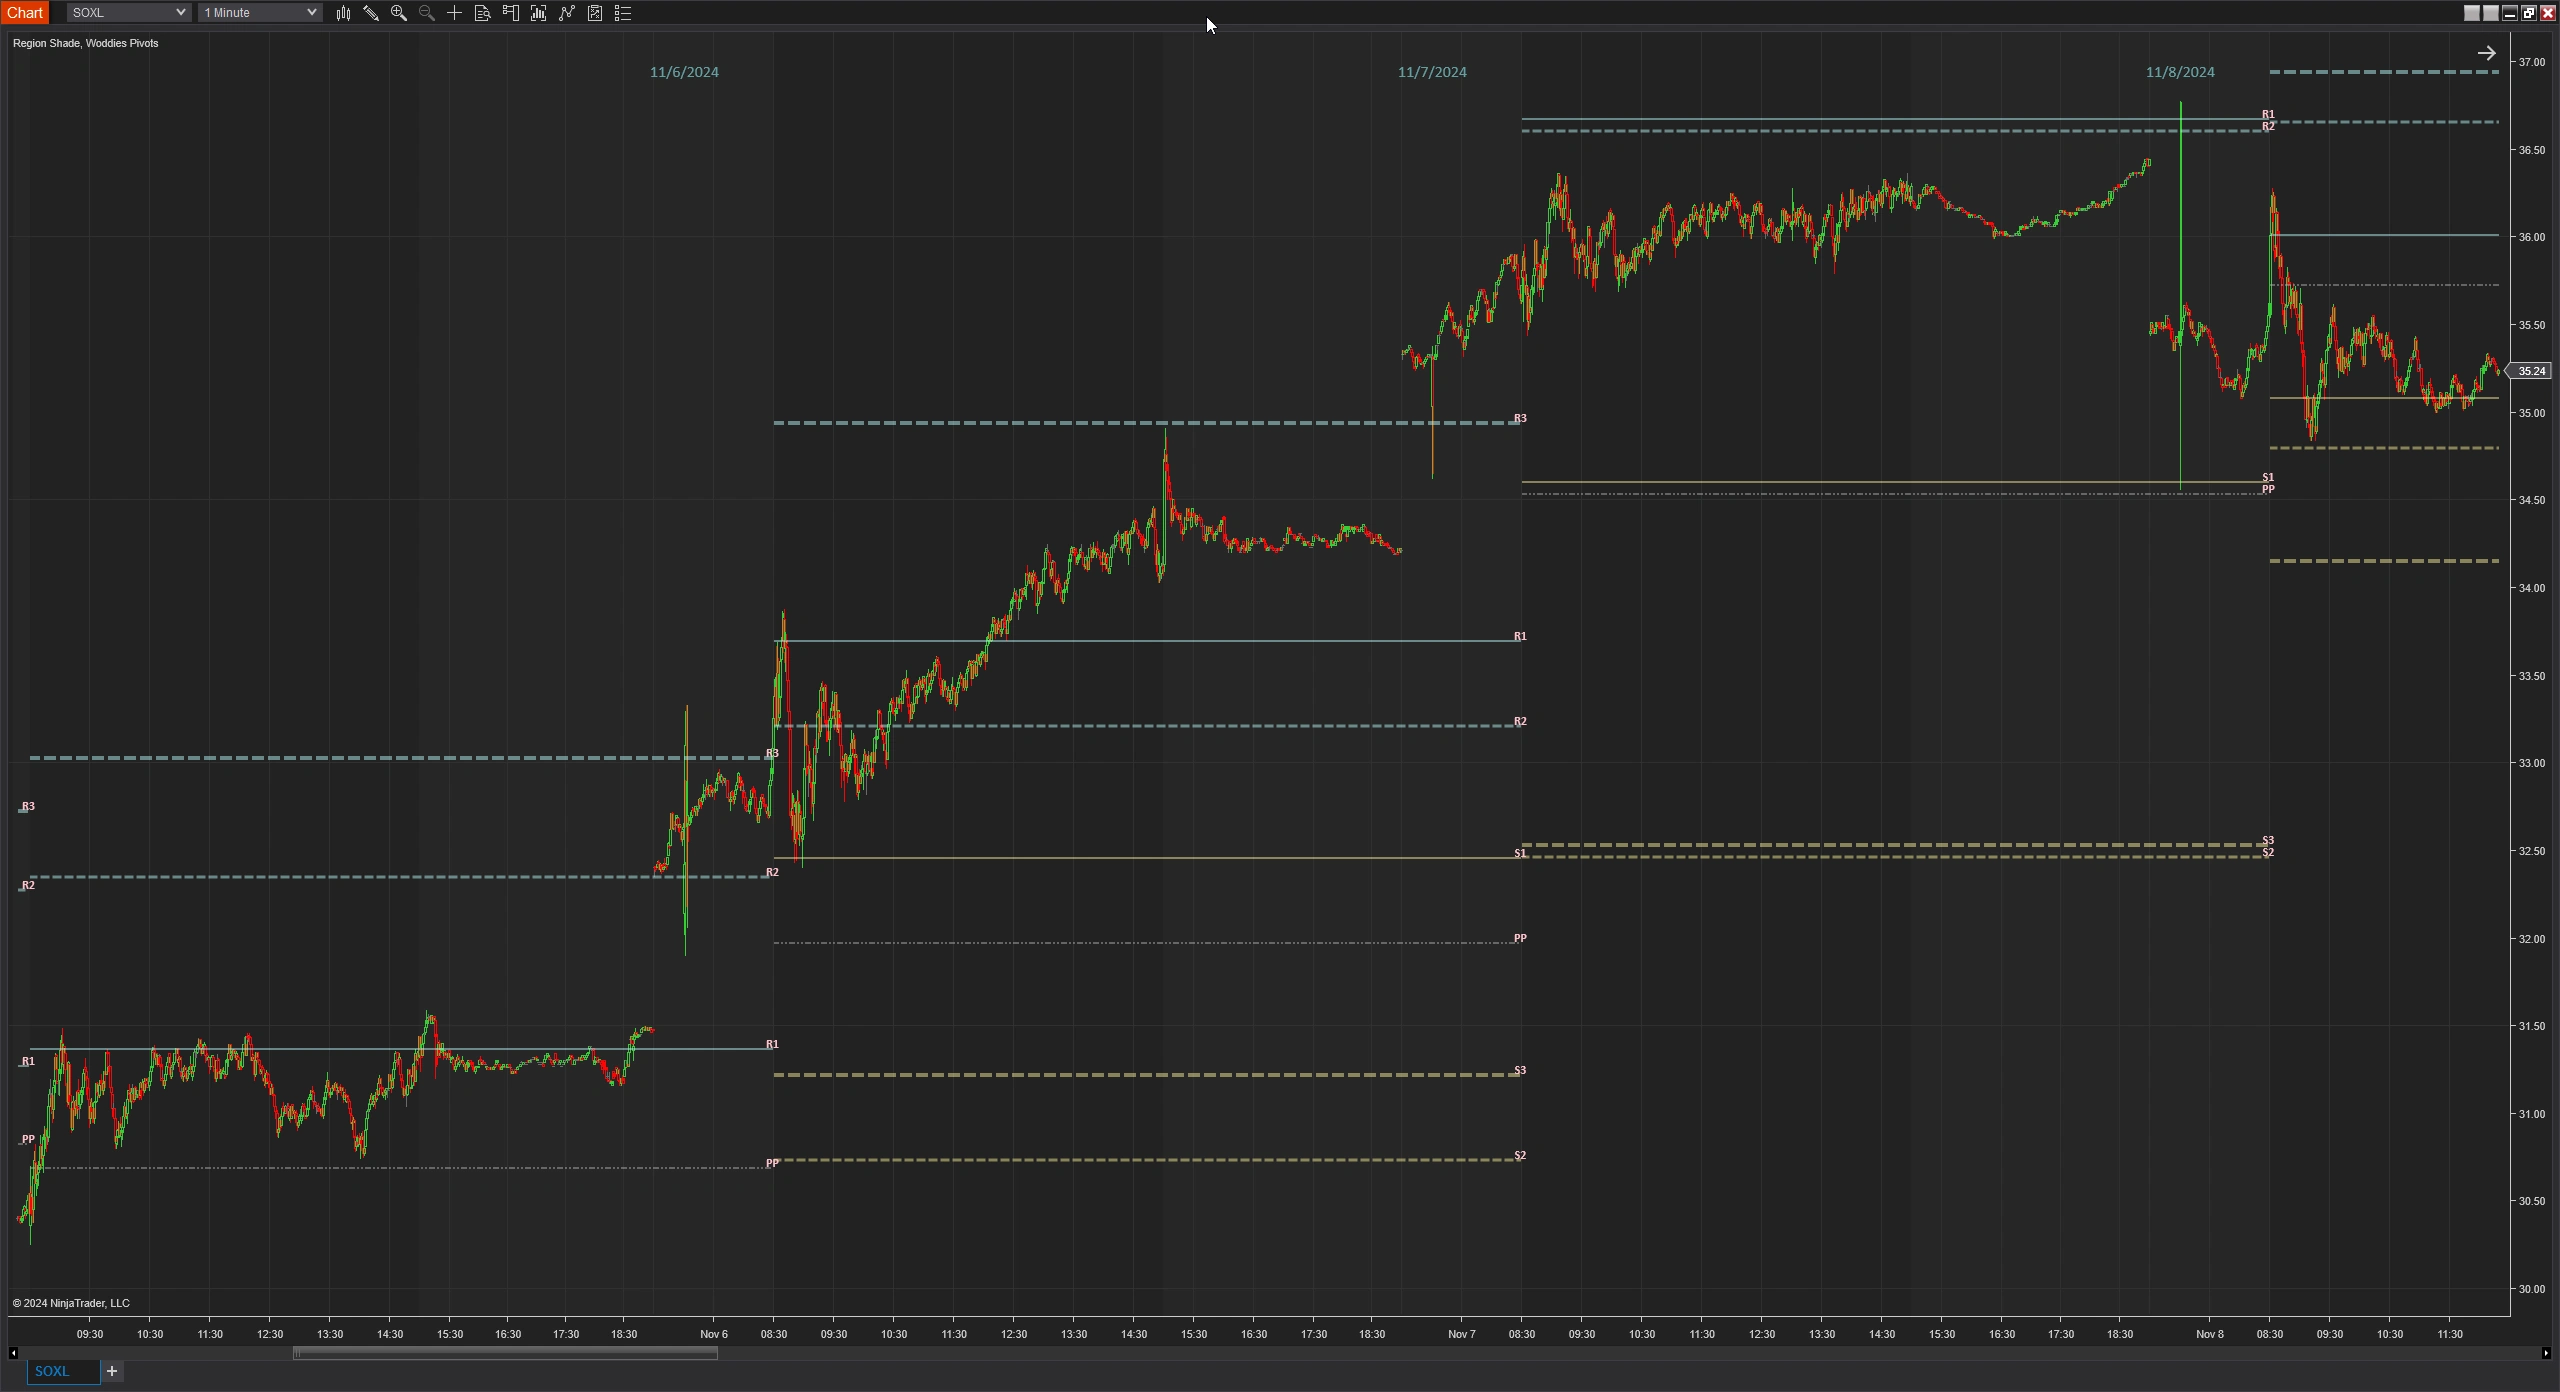
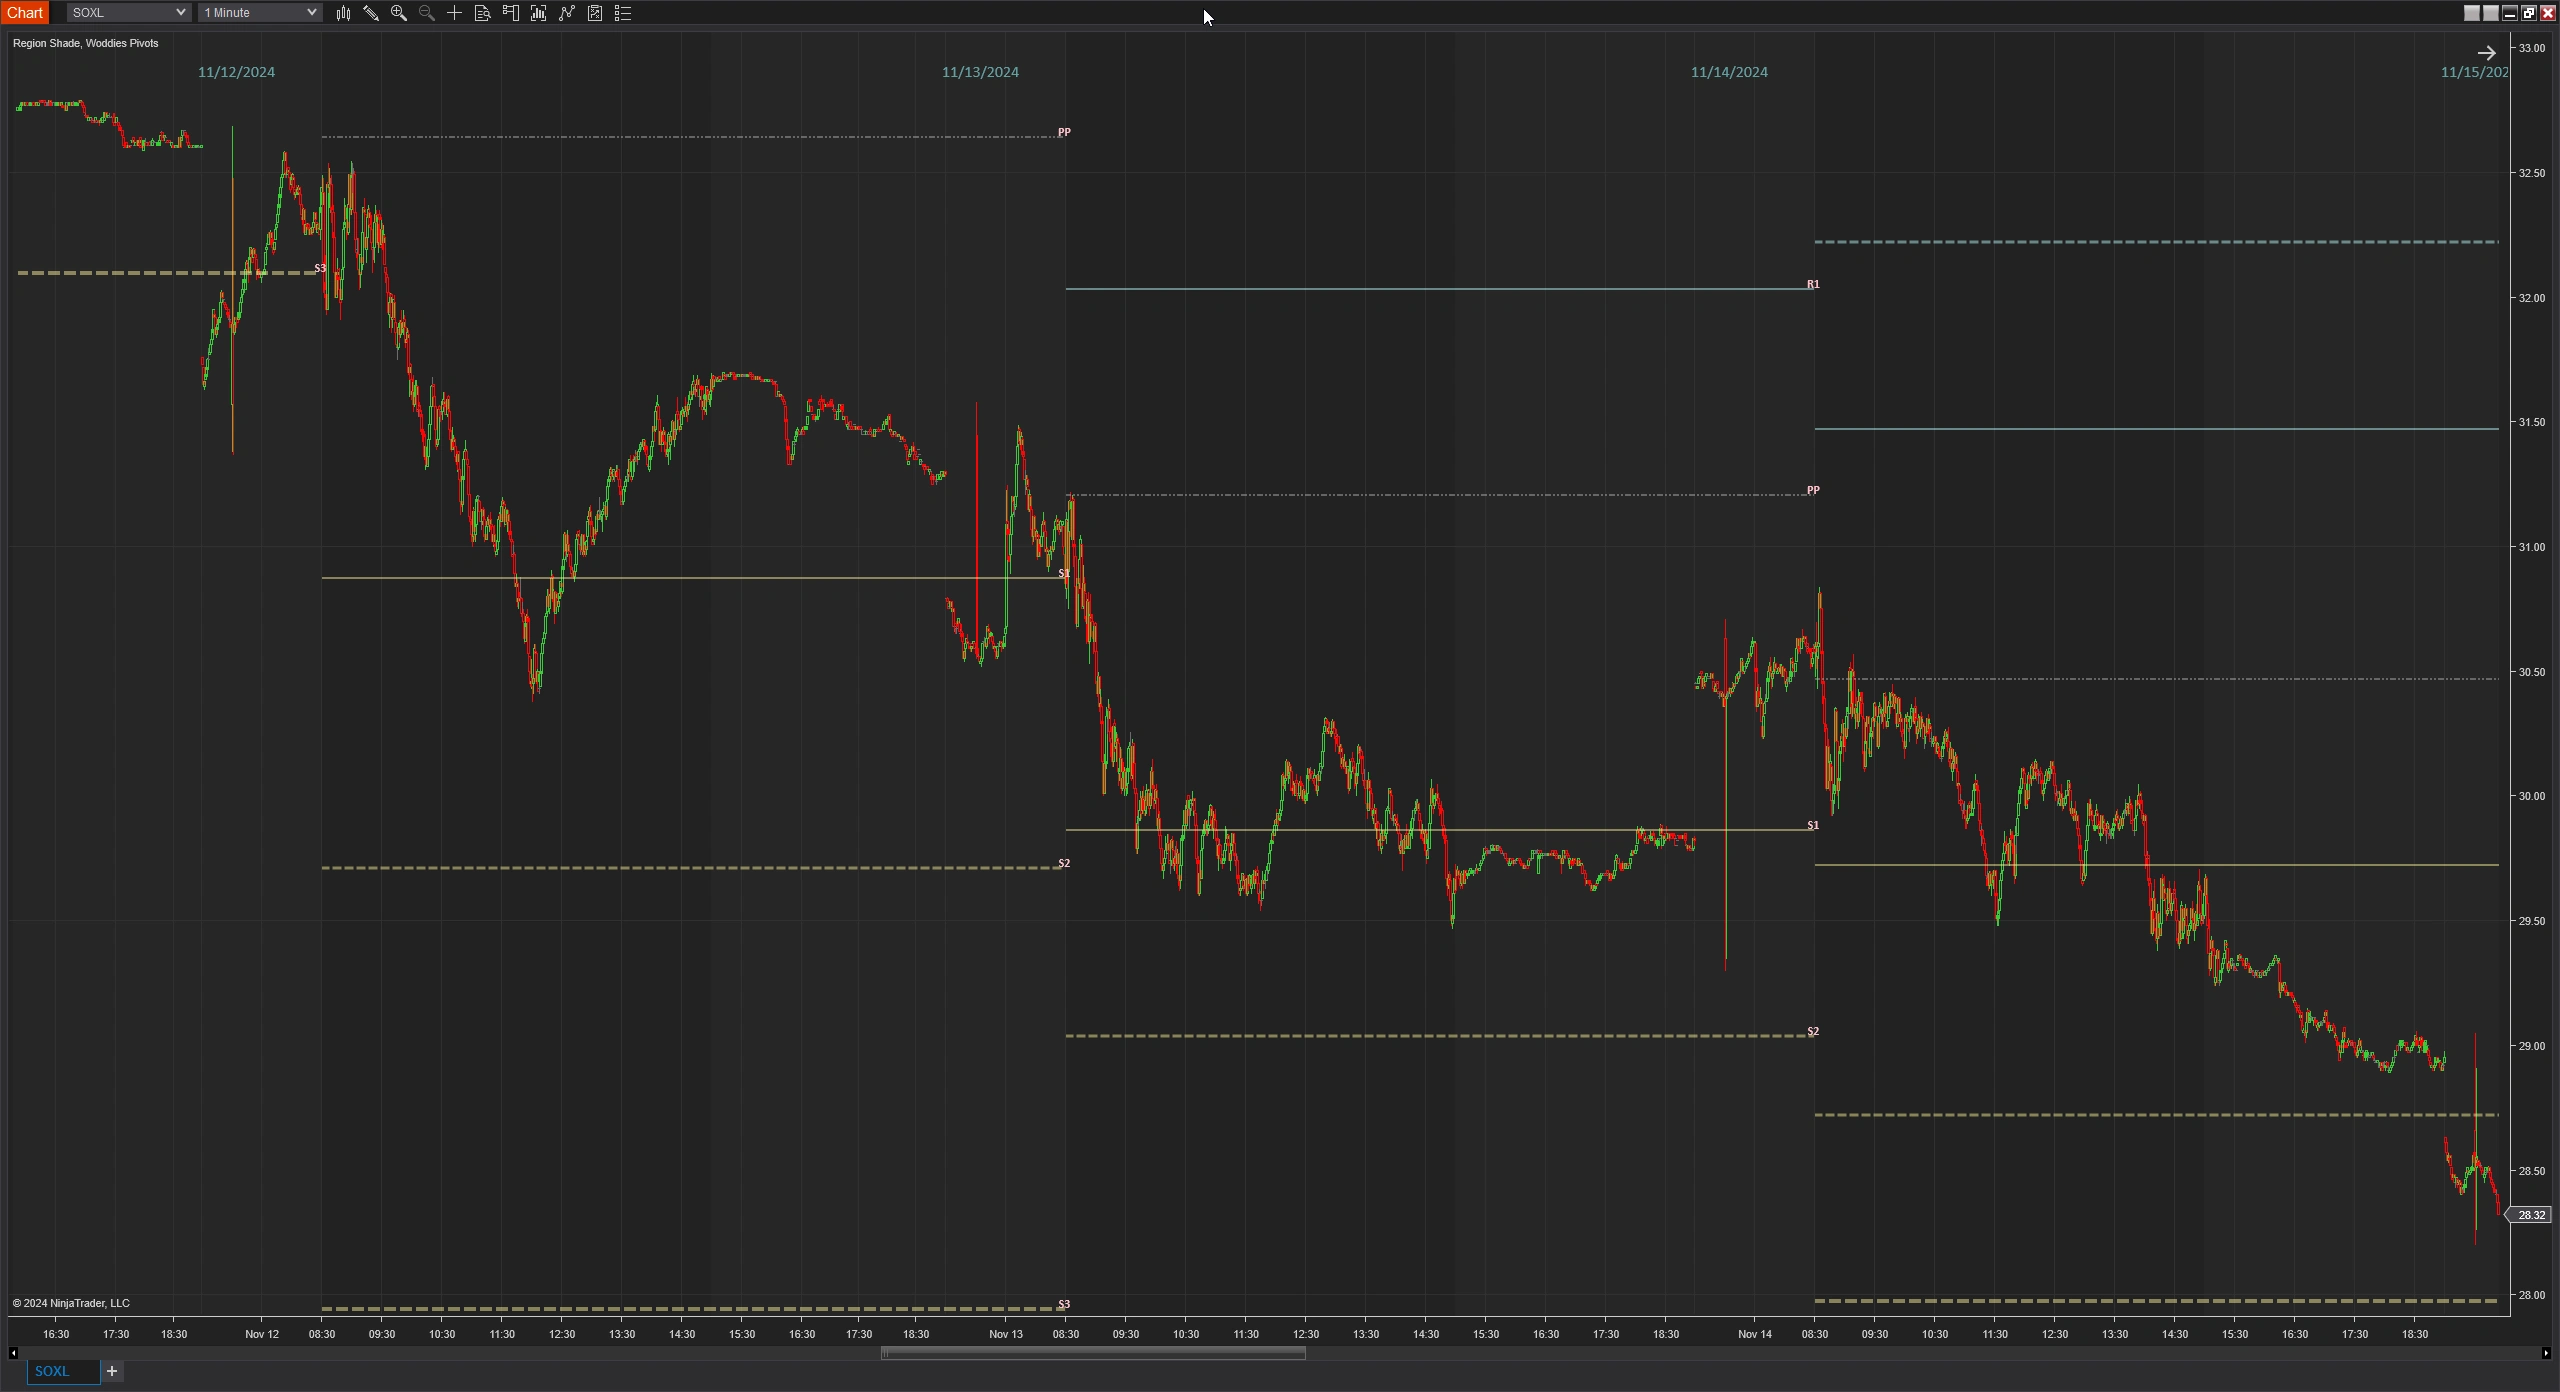
- Support and Resistance Levels: Generates multiple support (S1, S2, S3) and resistance (R1, R2, R3) levels that can help traders identify potential price reversal points.
- Trend Identification: By observing whether the price is trading above or below the pivot point (PP), traders can gauge bullish or bearish market tendencies.
How to Use Woodies Pivot Points in Trading
Identifying the Trend
- Bullish Trend: If the price is consistently trading above the pivot point (PP), it suggests bullish market behavior.
- Bearish Trend: If the price is consistently trading below the pivot point (PP), it indicates bearish market behavior.
Volume can also be used to confirm the trend:
- High Volume Above PP: Strengthens the bullish signal.
- High Volume Below PP: Reinforces the bearish signal.
Using Support and Resistance Levels
Once the trend is identified, support and resistance levels can be used to make trading decisions:
- Support Levels (S1, S2, S3): Potential areas where the price may find support and reverse upward.
- Resistance Levels (R1, R2, R3): Potential areas where the price may encounter resistance and reverse downward.
Trading Strategies
- Breakout Trading:
- Bullish Breakout: Enter a long position when the price breaks above a resistance level with strong volume.
- Bearish Breakout: Enter a short position when the price breaks below a support level with strong volume.
- Reversal Trading:
- At Support Levels: Look for buying opportunities near support levels if the trend is bullish.
- At Resistance Levels: Consider selling or shorting near resistance levels if the trend is bearish.
- Pivot Point Bounce: If the price retraces to the pivot point (PP) after moving away, it may bounce off this level, providing an entry opportunity in the direction of the trend.
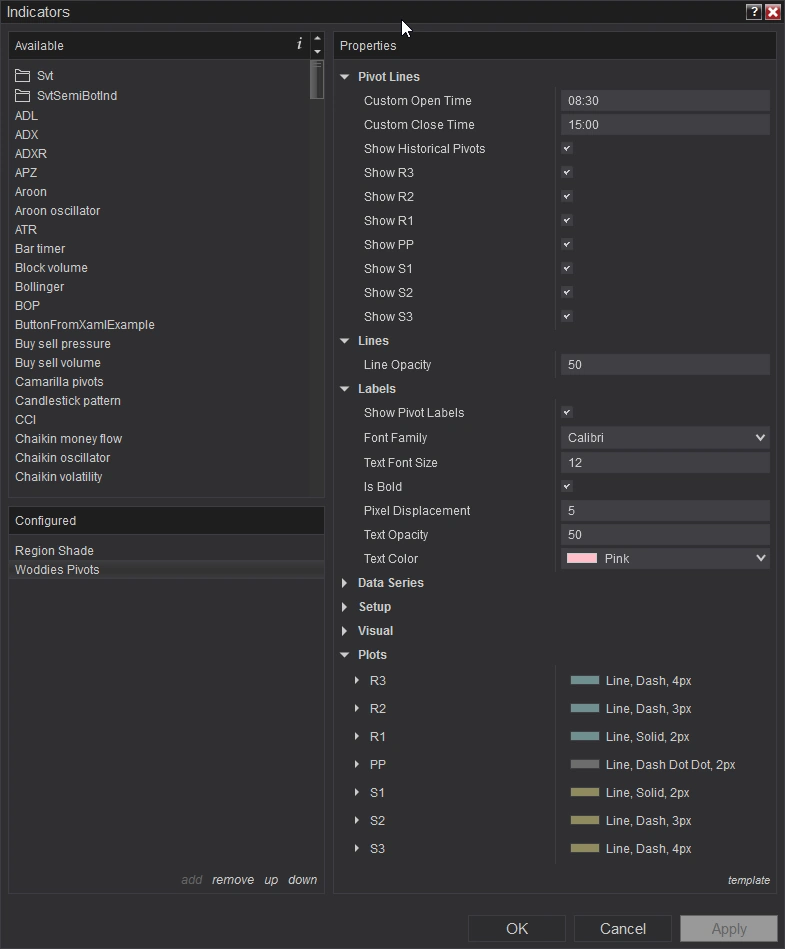
Customization and Features of the Woodies Pivot Points Indicator
The Woodies Pivot Points indicator provides several features and customization options to enhance its utility:
Custom Open and Close Times
- Flexibility: Allows traders to set custom open and close times to match different trading sessions or time zones.
- Adaptability: Useful for markets with specific trading hours or for traders operating across different time zones.
Display Options
- Show/Hide Specific Levels: Traders can choose which support and resistance levels to display (S1, S2, S3, R1, R2, R3, and PP).
- Show Historical Pivots: Option to display pivot levels from previous periods for historical analysis.
Visual Customization
- Line Styles and Colors: Adjust the appearance of pivot lines, including color, style (solid, dashed), width, and opacity.
- Labels and Fonts: Enable or disable labels for pivot levels and customize font family, size, boldness, and text color.
- Text Opacity and Displacement: Control the transparency of text labels and adjust their position relative to the pivot lines.
Practical Tips for Using the Indicator
- Set Appropriate Session Times:
- Ensure that the custom open and close times align with the trading session you're analyzing.
- For example, if trading U.S. equities, you might set the open time to 9:30 AM and close time to 4:00 PM Eastern Time.
- Focus on Relevant Levels:
- Customize the indicator to display only the pivot levels that are most relevant to your trading strategy.
- Hiding unnecessary levels can declutter the chart and help you focus on key areas.
- Combine with Other Analysis Tools:
- Use Woodies Pivot Points alongside other technical indicators such as moving averages, RSI, or MACD to confirm signals.
- Consider price action signals like candlestick patterns at pivot levels for additional confirmation.
- Monitor Volume:
- Pay attention to trading volume when price approaches pivot levels.
- High volume near a pivot point can indicate a stronger likelihood of a significant price move.
- Practice Risk Management:
- Always use stop-loss orders to protect against adverse movements.
- Determine your risk tolerance and set position sizes accordingly.
Review the screenshots and video for setup options.
Click here for a list of all of NinjaTrader's Downloads.

Screenshots
Media