sharp vision traders
Enhancing Your Trading Experience

Trader’s Dynamic Index (NT)
- Categories: Indicator, NinjaTrader
- Tags: Adaptive, RSI, Trend
- Type: Free
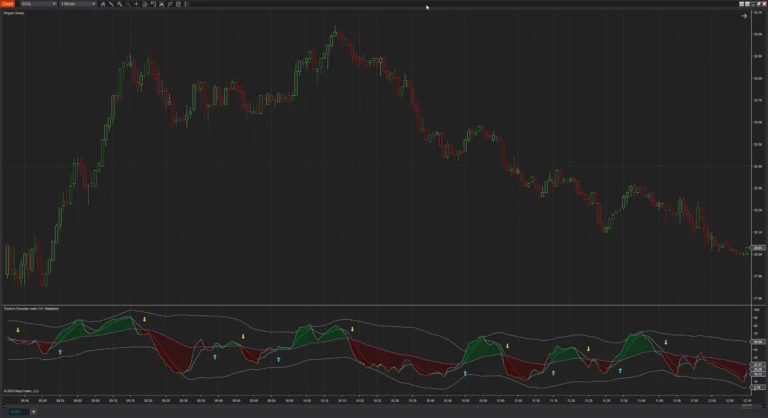
The Trader's Dynamic Index for NinjaTrader is a tool that blends the RSI with smoothed moving averages and volatility bands.
Note: This download requires NinjaTrader 8 release 8.1.3 or newer.
What Is the Trader's Dynamic Index?
The Trader's Dynamic Index (TDI) for NinjaTrader is a versatile indicator that blends the RSI with smoothed moving averages and volatility bands (similar to Bollinger Bands) applied directly to the RSI data. This combination offers a dynamic approach to assessing market momentum, trend direction, and volatility.
Key Components:
- RSI (Relative Strength Index): Measures the speed and change of price movements.
- Smoothed RSI Lines:
- Fast Line: A shorter-term smoothed RSI line for capturing quick momentum changes.
- Slow Line: A longer-term smoothed RSI line that helps identify the underlying trend.
- Volatility Bands:
- Upper and lower bands calculated using standard deviation applied to the RSI.
- Represent overbought and oversold zones relative to the RSI's volatility.
- Middle Line: A moving average of the RSI, acting as a signal line for trend confirmation.
- Shading Zones:
- Visual highlights between the RSI lines to indicate bullish or bearish conditions.
- Scalping Shade: Highlights short-term trading conditions.
- Long-Term Shade: Highlights longer-term trend conditions.
- Buy/Sell Signals: Optional visual markers indicating potential entry points based on specific conditions.
How Does the Trader's Dynamic Index Work?
Step 1: Calculating the RSI
- Input Data Source: You can select the data source for the RSI calculation, such as Close, High-Low Average (HL2), High-Low-Close Average (HLC3), Open-High-Low-Close Average (OHLC4), Volume Weighted Average Price (VWAP), and more.
- RSI Period: The number of periods used for the RSI calculation (e.g., 14 periods).
- RSI Averaging Methods:
- Various moving average methods can be applied, including:
- Simple Moving Average (SMA)
- Exponential Moving Average (EMA)
- Wilder's Moving Average
- Hull Moving Average (HMA)
- Volume Weighted Moving Average (VWMA)
- Triple Exponential Moving Average (TEMA)
- Arnaud Legoux Moving Average (ALMA)
- Adaptive Exponential Moving Average (AEMA)
- Kaufman Adaptive Moving Average (KAMA)
- Fractal Adaptive Moving Average (FRAMA)
- Various moving average methods can be applied, including:
Step 2: Smoothing the RSI Lines
- Fast RSI Line: Smoothed over a shorter period (e.g., 2 periods) to capture short-term momentum.
- Slow RSI Line: Smoothed over a longer period (e.g., 7 periods) to identify the underlying trend.
Step 3: Calculating the Volatility Bands
- Middle Line: A moving average of the RSI, often using a different period or averaging method. The range of methods is the same as the above.
- Volatility Period: The number of periods over which the standard deviation is calculated (e.g., 34 periods).
- Standard Deviation Multiplier: A factor (e.g., 1.6185) applied to the standard deviation to set the width of the bands.
- Upper and Lower Bands: Calculated by adding and subtracting the multiplied standard deviation from the middle line.
Step 4: Applying Shading for Visual Signals
- Scalping Shade: Highlights the area between the Fast and Slow RSI lines when specific conditions are met.
- Long-Term Shade: Highlights the area between the Slow RSI and the Middle Line.
Step 5: Optional Buy/Sell Signals
- Purpose: Provides visual markers (arrows) on the chart to indicate potential long (buy) or short (sell) opportunities based on the TDI's analysis.
- Customization:
- Traders can choose to display these signals on the price panel or within the indicator panel.
- Option to focus on either scalping signals (short-term) or long-term signals.
- Customizable colors for the long and short signals.
Interpreting the Trader's Dynamic Index
Understanding the Lines
- Fast RSI Line (e.g., Pale Goldenrod Line): Represents short-term momentum.
- Crosses above the Slow RSI may signal increasing bullish momentum.
- Crosses below the Slow RSI may signal increasing bearish momentum.
- Slow RSI Line: Indicates the underlying trend and acts as a signal line for the Fast RSI.
- Middle Line:
- Serves as a reference for the overall trend.
- RSI values above the Middle Line suggest bullish conditions.
- RSI values below the Middle Line suggest bearish conditions.
- Upper and Lower Bands: Represent overbought and oversold zones relative to RSI volatility. RSI touching or crossing these bands may indicate potential reversal points.
Using Shading for Visual Insights
- Scalping Shade: When enabled, it visually emphasizes short-term trading conditions.
- Long-Term Shade: Highlights longer-term trend conditions.
Review the screenshots and video for setup options.
Click here for a list of all of NinjaTrader's Downloads.

Screenshots
Media
