
sharp vision traders
Enhancing Your Trading Experience

Marker Indicator (NT)
- Categories: Indicator, NinjaTrader
- Tags: Oscillator
- Type: Free
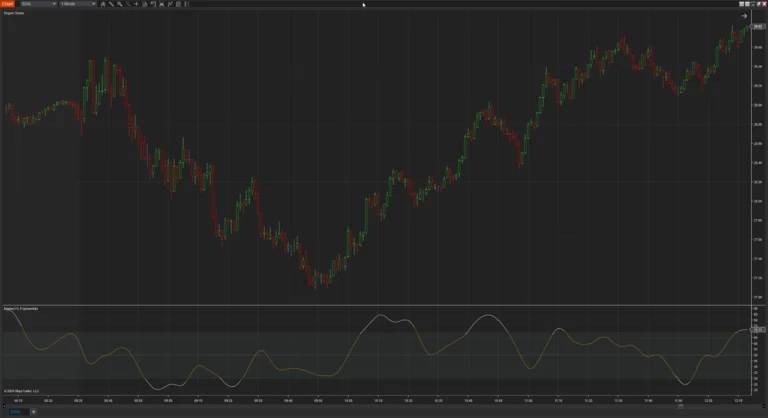
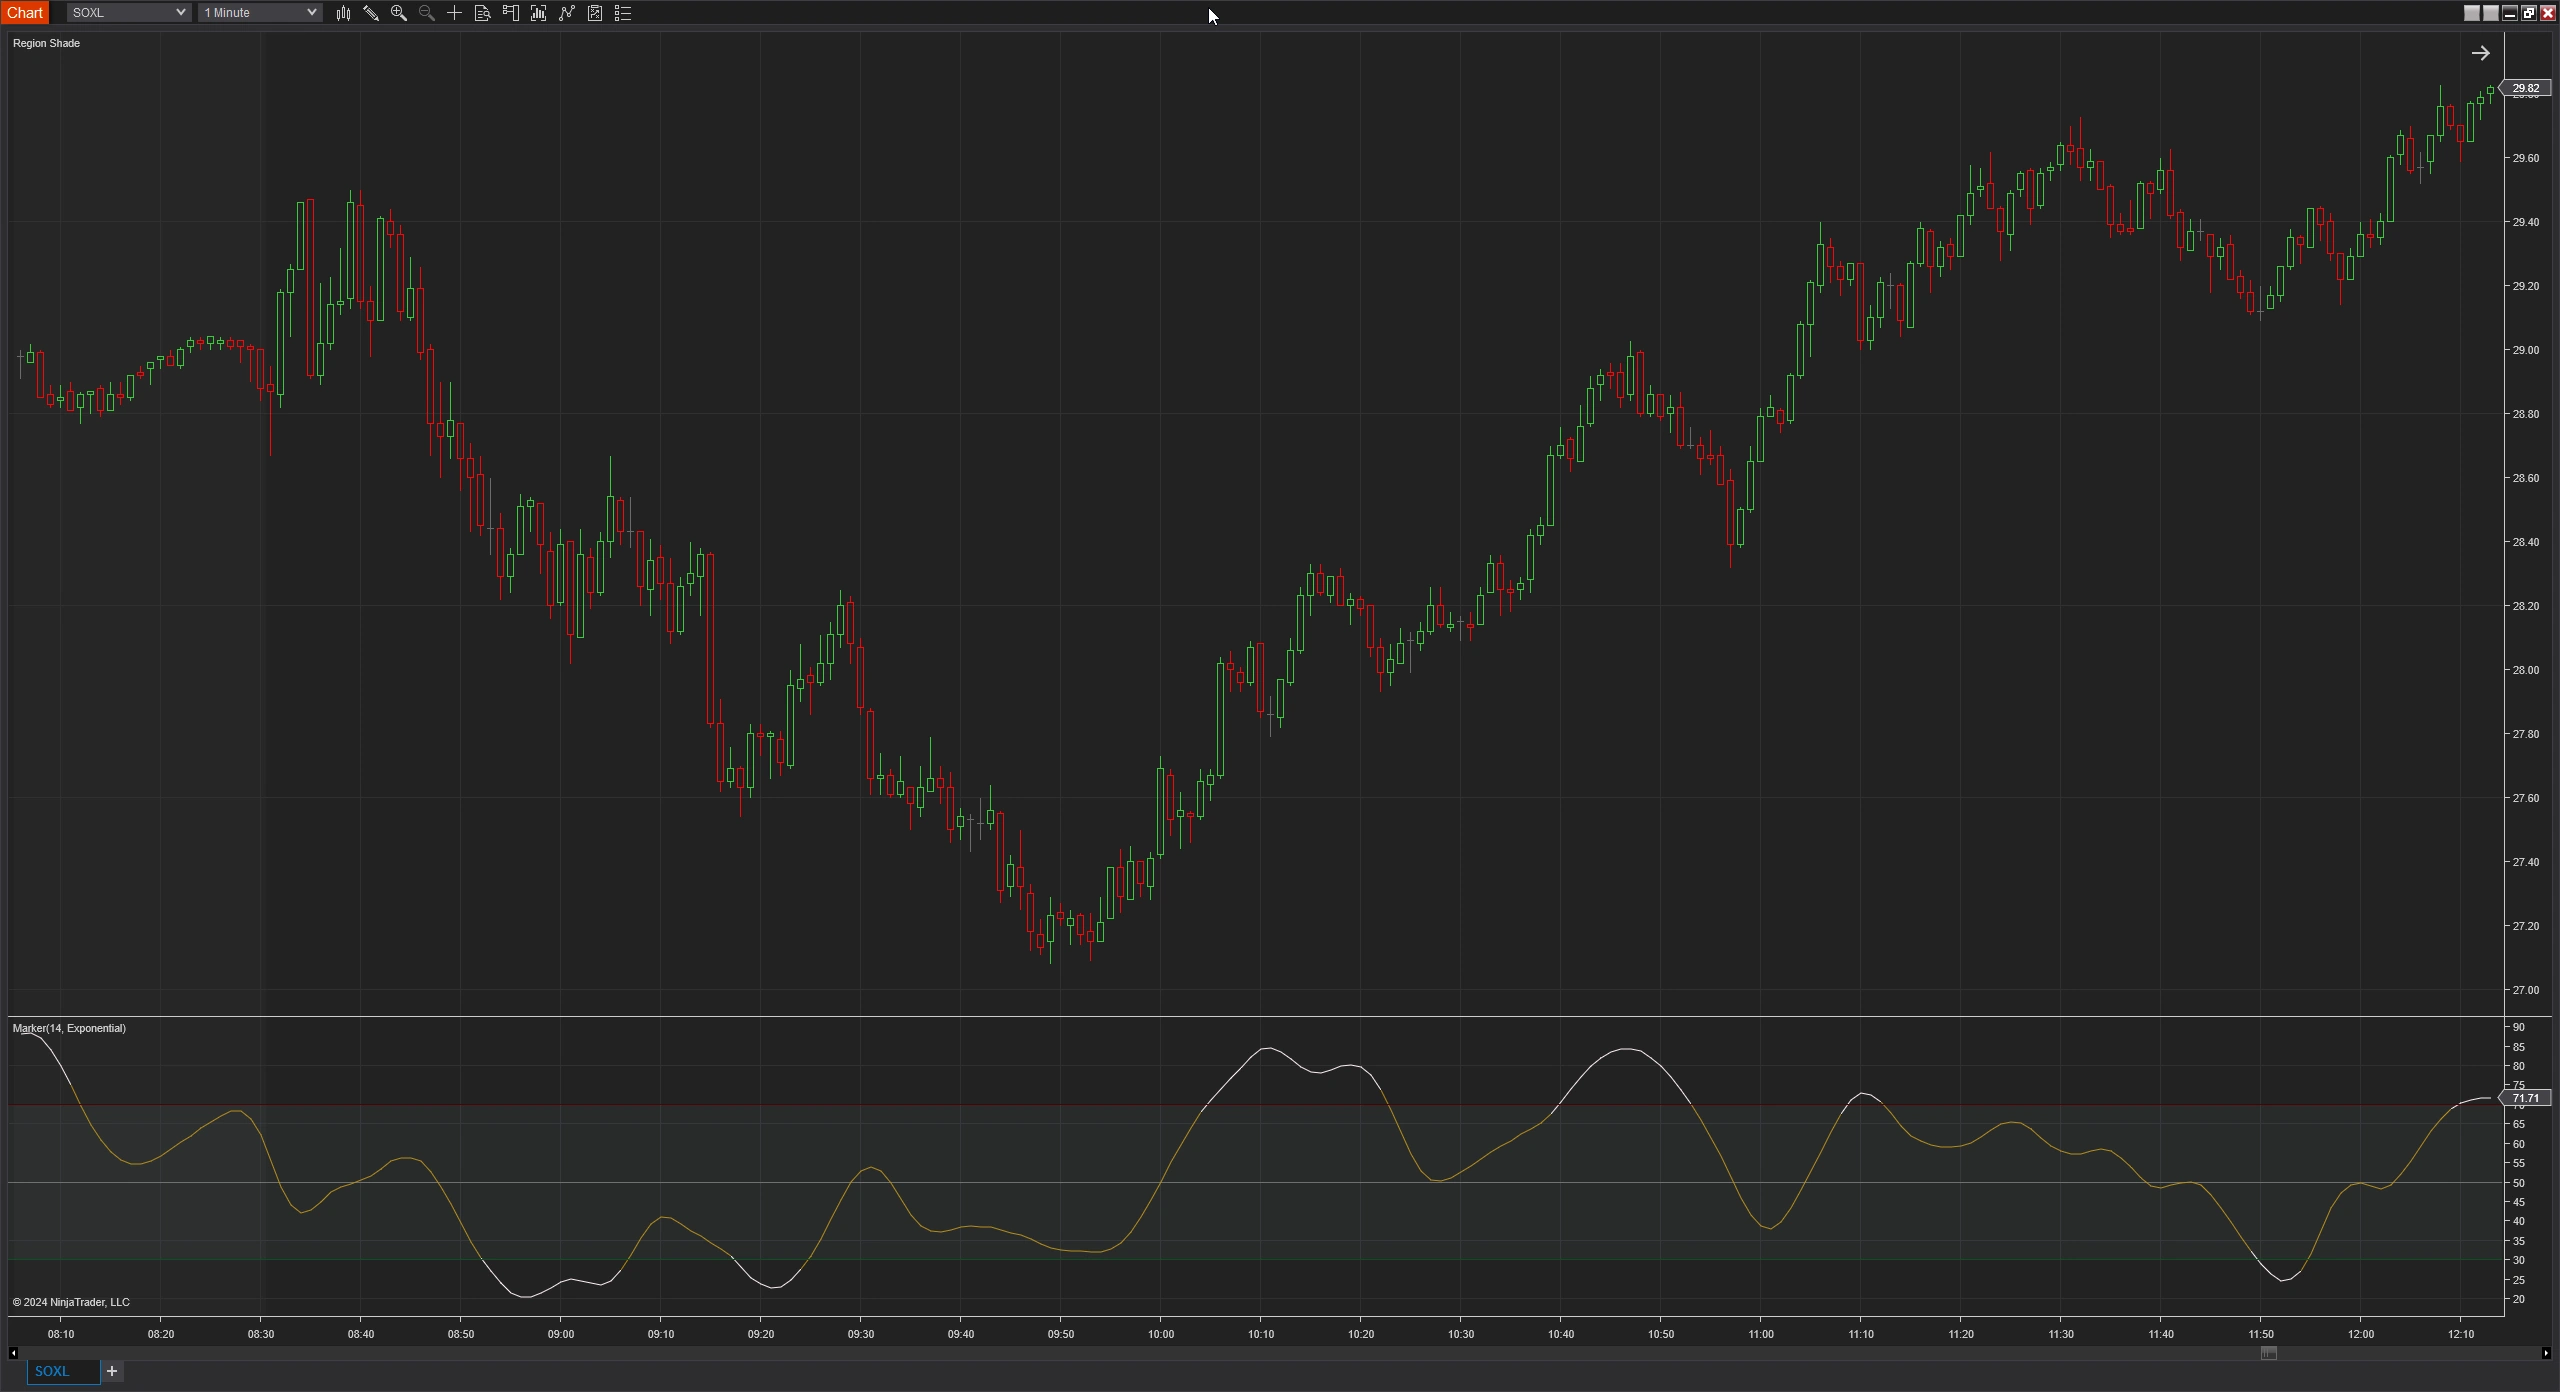
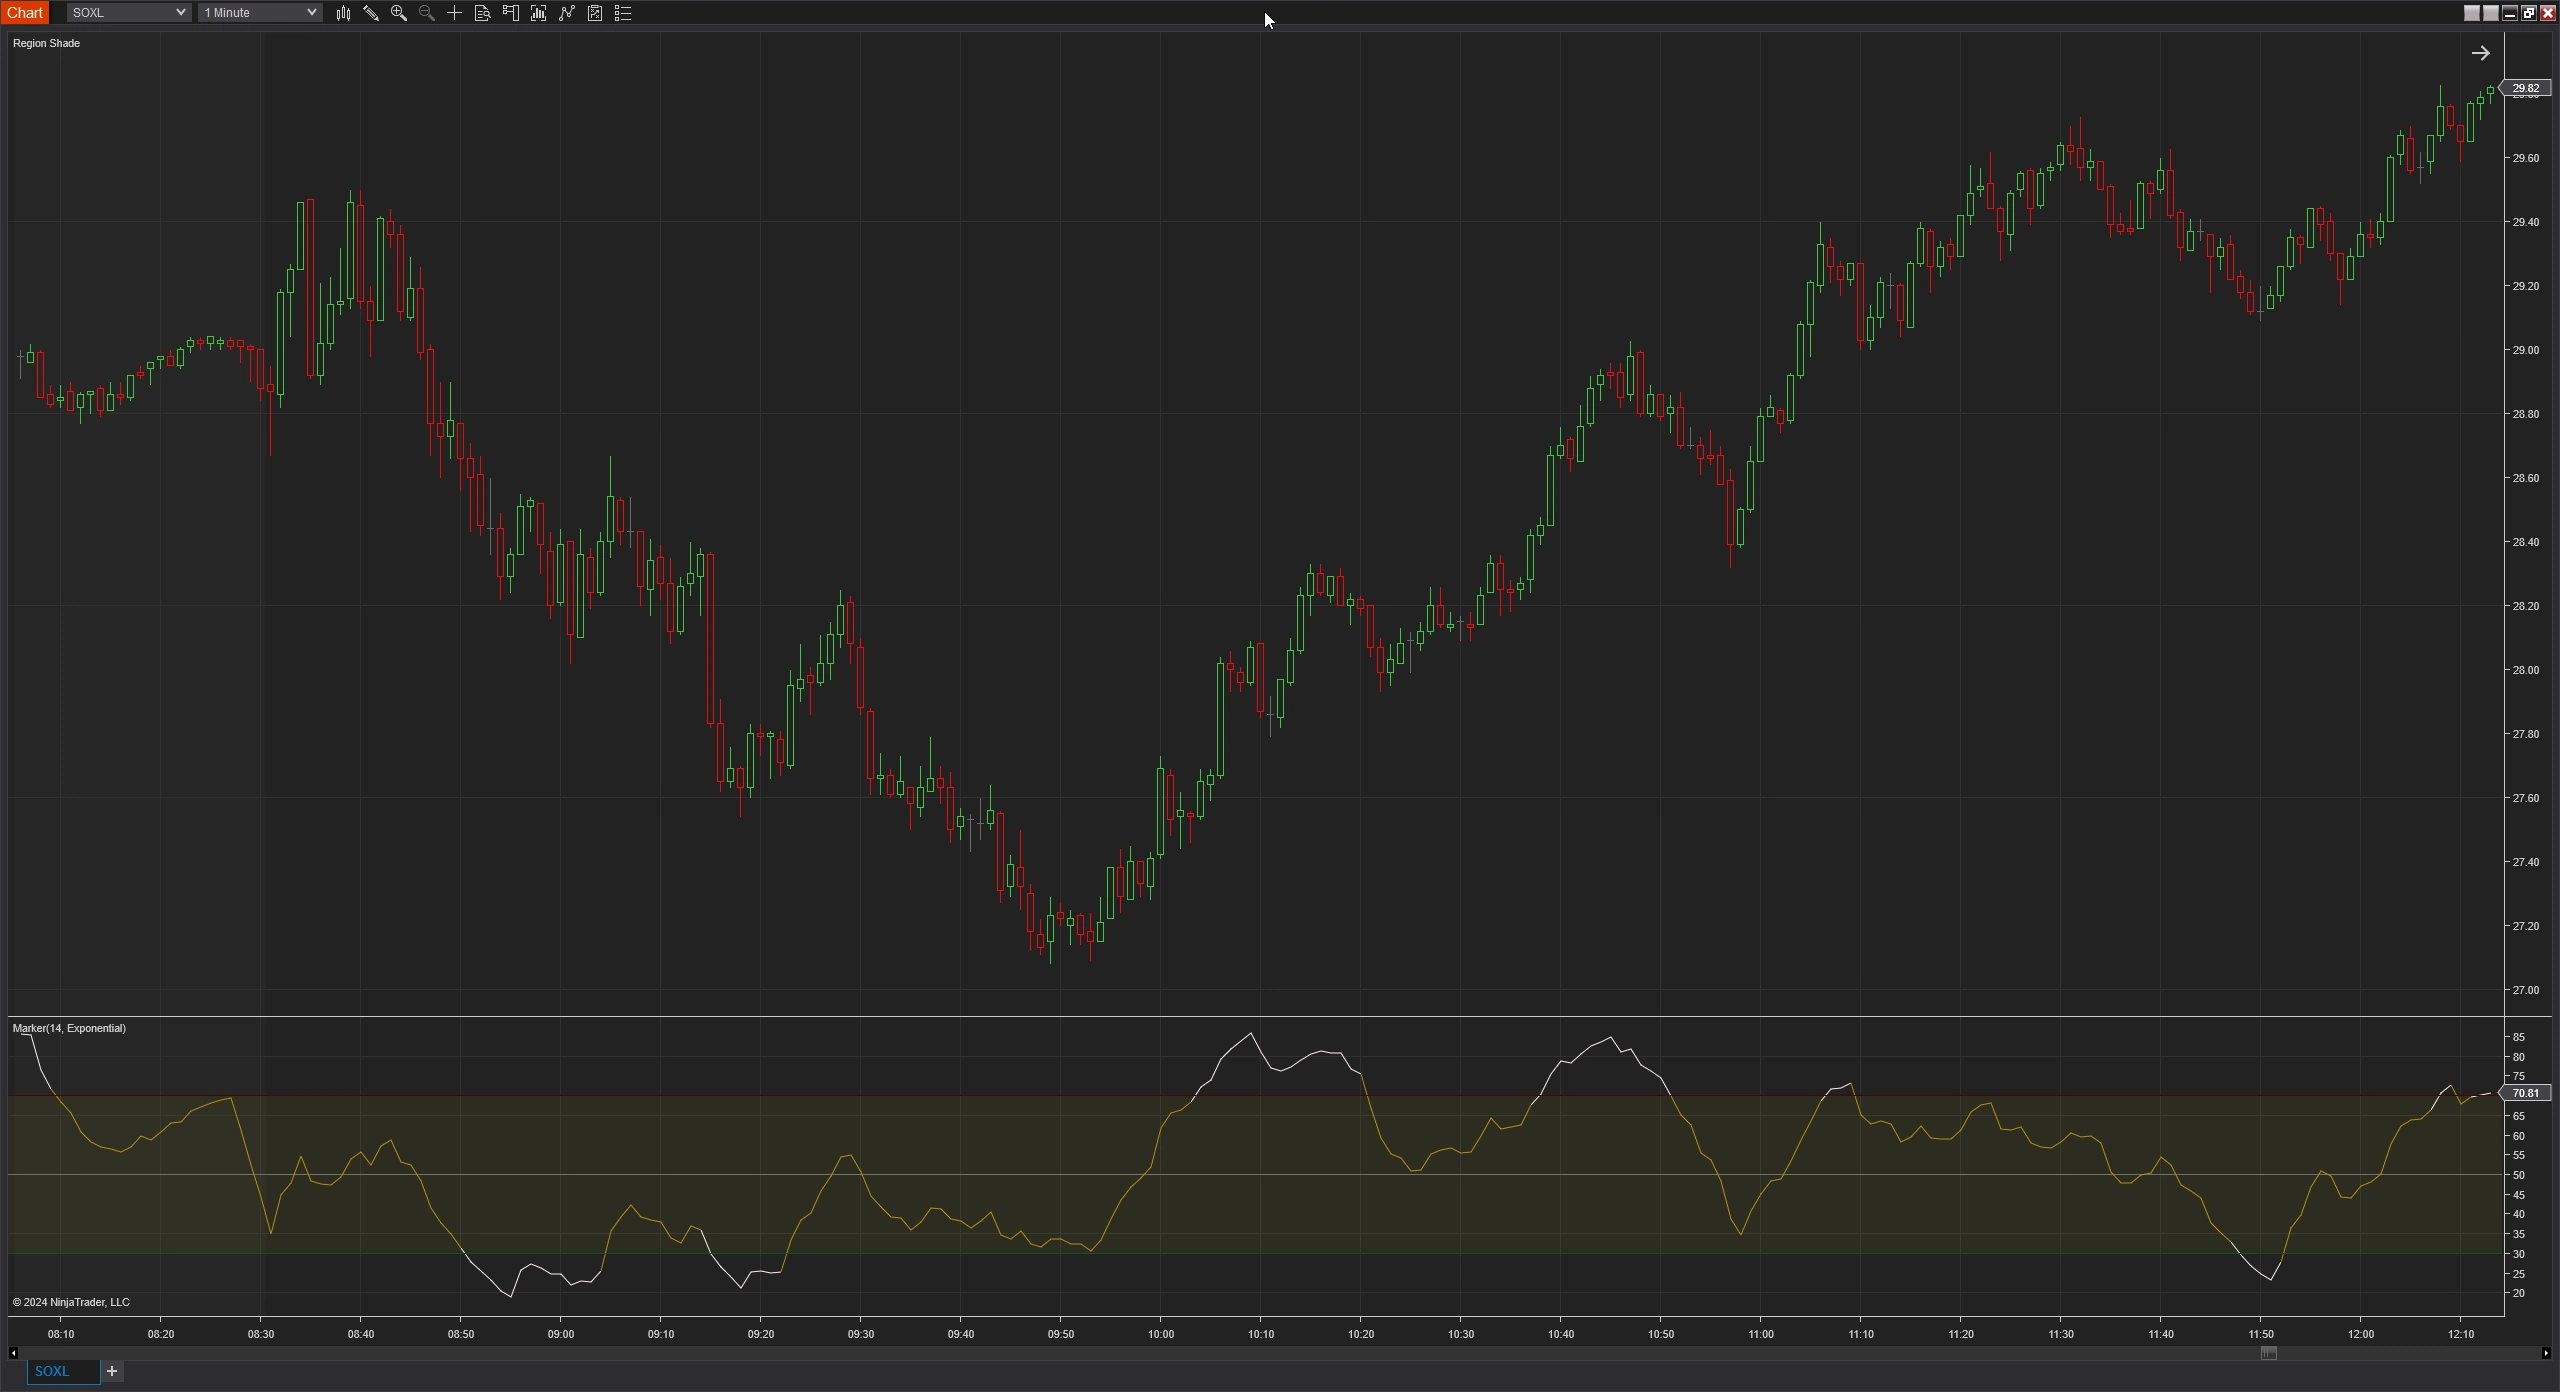
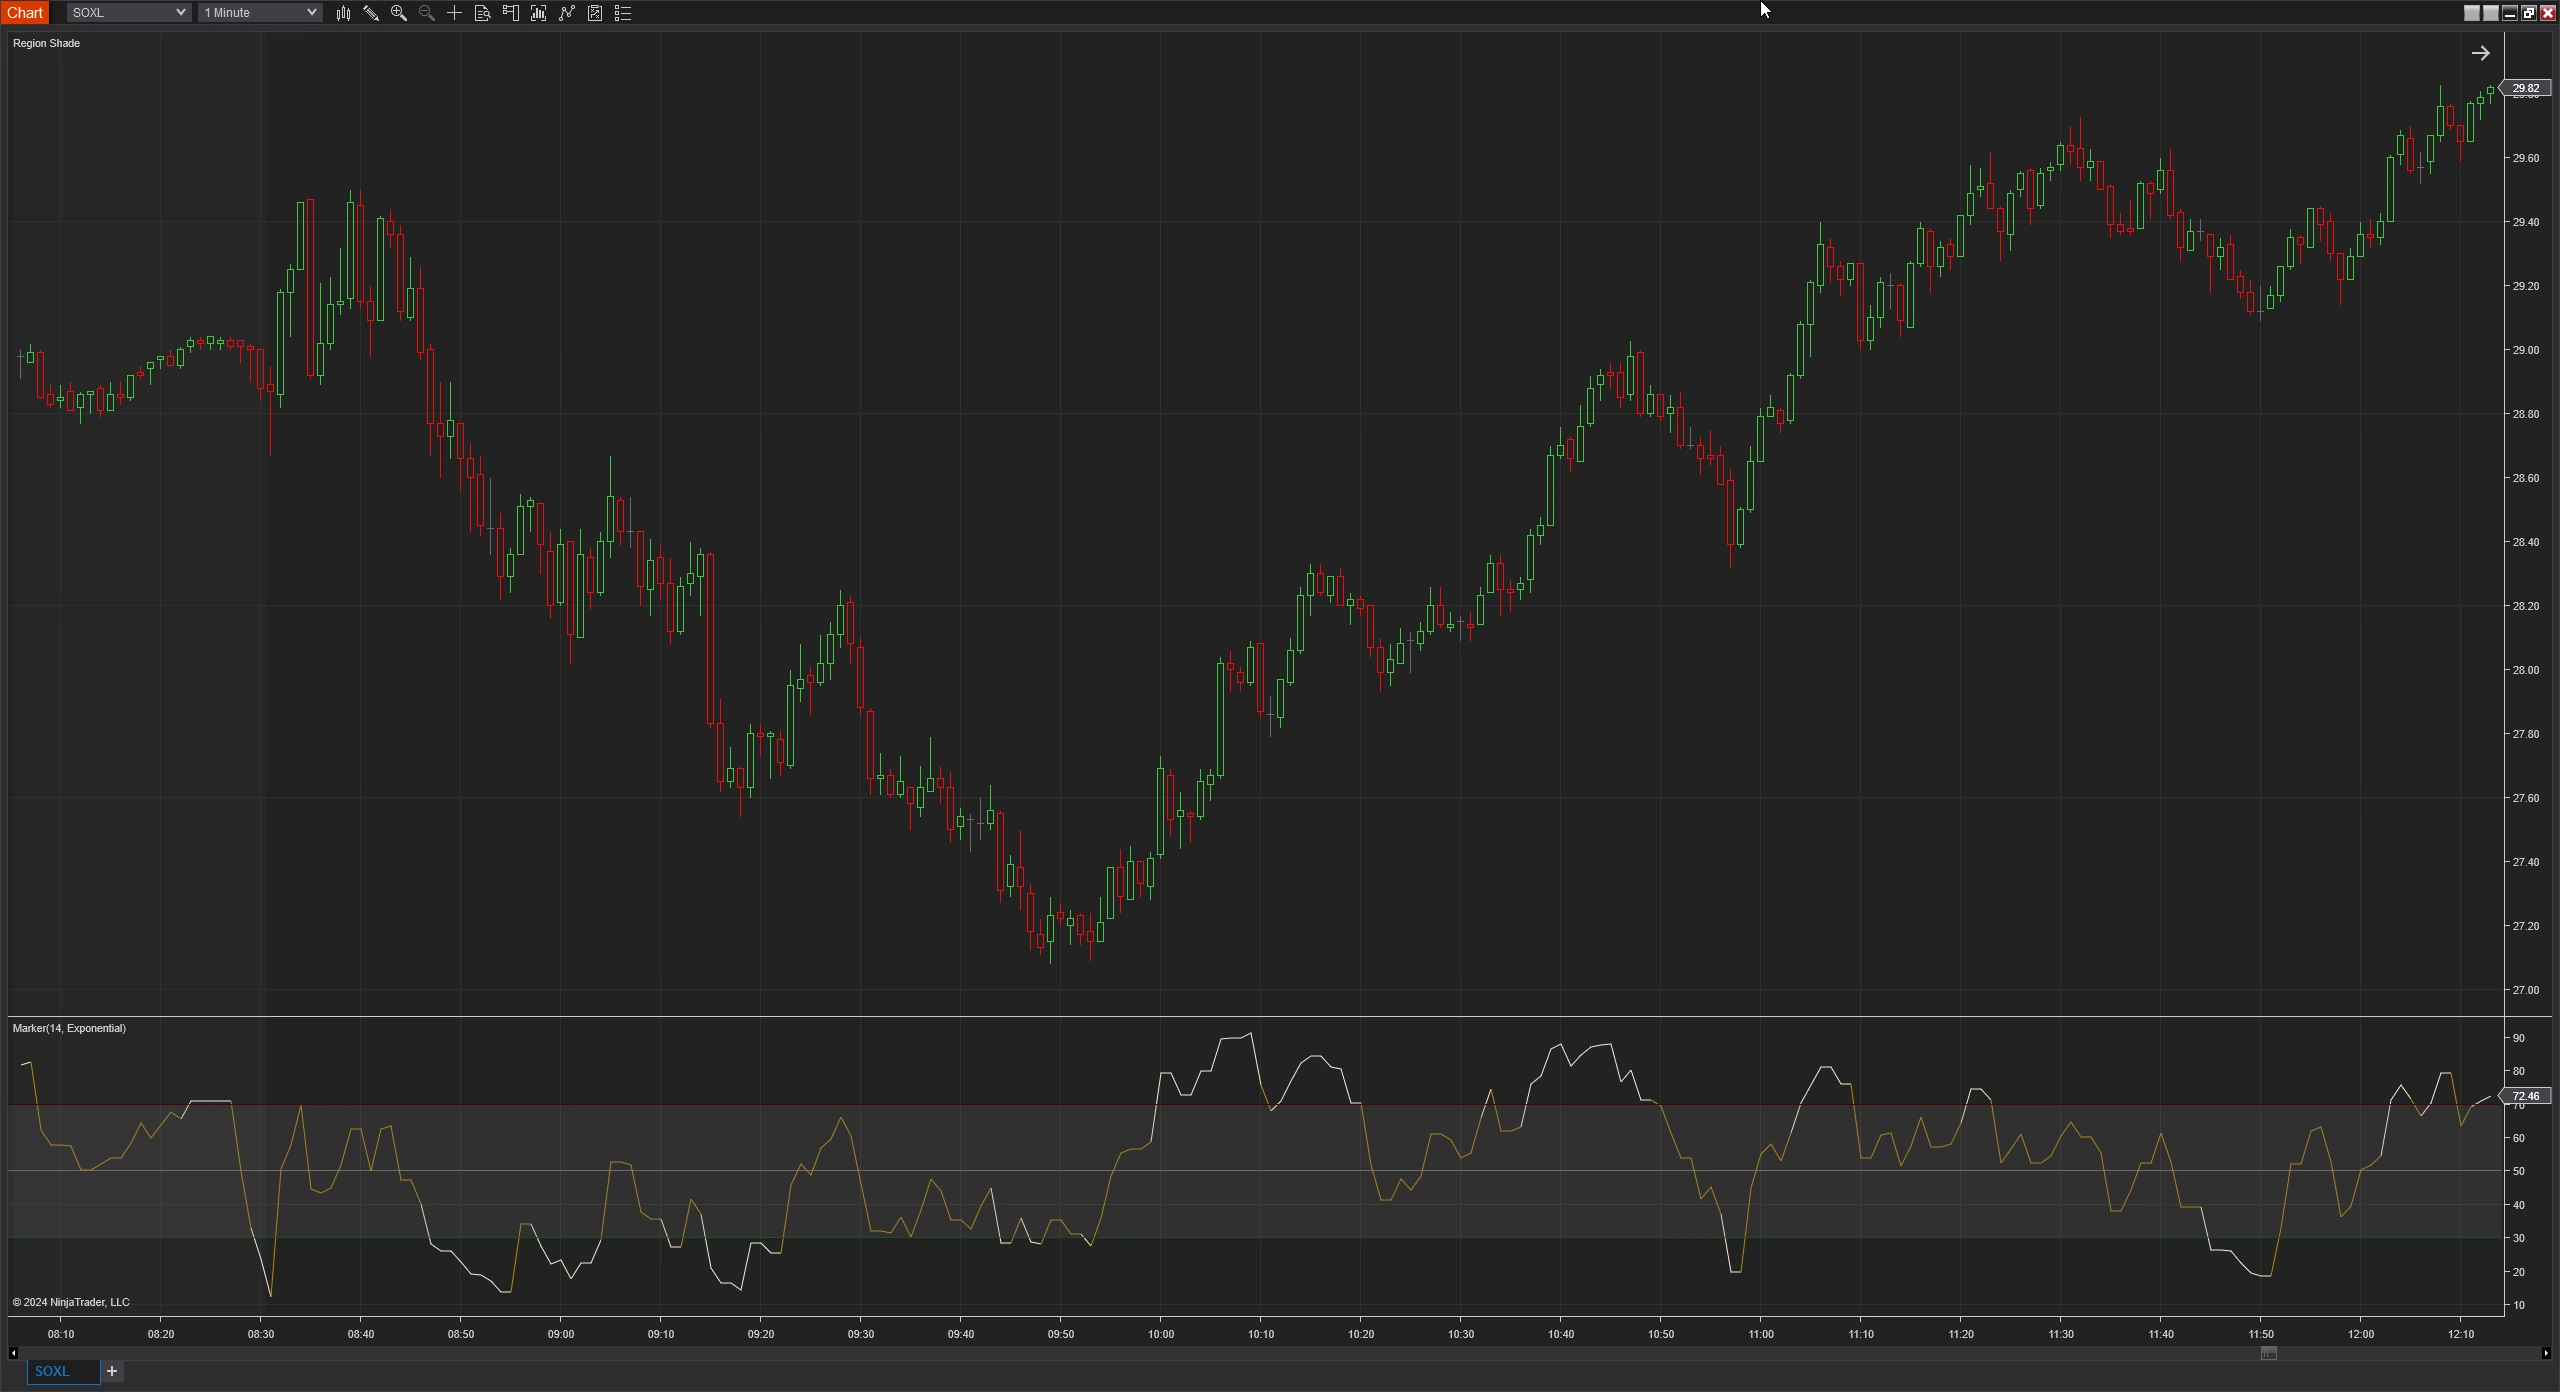
The Marker Indicator for NinjaTrader is a technical analysis tool that helps traders identify potential trend reversals by analyzing changes in high and low prices over time. The Marker Indicator offers signals for market entry and exit, allowing traders to stay ahead of the curve.
Note: This download requires NinjaTrader 8 release 8.1.3 or newer.
Introduction Marker Indicator
The Marker Indicator for NinjaTrader is a technical analysis tool that helps traders identify potential trend reversals by analyzing changes in high and low prices over time. The Marker Indicator offers signals for market entry and exit, allowing traders to stay ahead of the curve.
But the Marker Indicator does more than just detect trend changes. It comes equipped with highly customizable features that allow traders to adapt it to their specific strategies and market conditions.
Key Features of the Marker Indicator
- High and Low-Price Comparison: At its core, the Marker Indicator tracks changes in high and low prices over time. By comparing today’s high price with the previous day’s high and the previous day’s low with today’s low, it calculates key price differences. This analysis helps traders gauge whether the market is shifting toward bullish or bearish momentum.
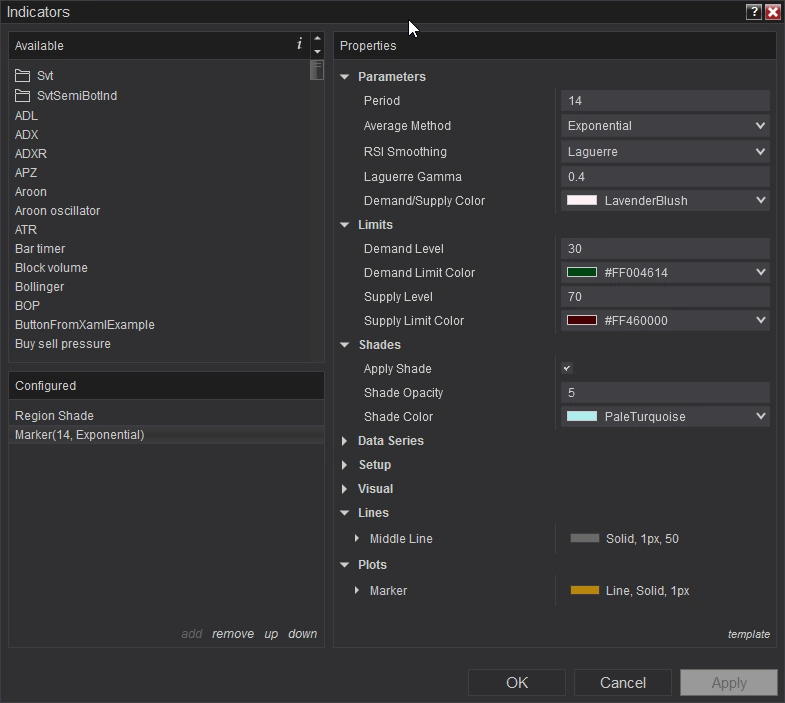
- Customizable Lookback Periods: The Marker Indicator offers flexibility in how you analyze the market by allowing you to adjust the lookback period. Whether you prefer shorter or longer periods for trend detection, you can customize the number of bars the indicator looks back (default set to 8 days), making it adaptable to your unique trading style.
- Multiple Averaging Methods:
- The strength of the Marker Indicator lies in its variety of smoothing methods. Traders can choose from different types of averages to tailor the indicator to current market conditions:
- Simple Moving Average (SMA): For those who prefer a straightforward approach to smoothing price data.
- Exponential Moving Average (EMA): Adds more weight to recent data points for quicker responses to price changes.
- Hull Moving Average (HMA): Offers a fast, smooth moving average that can reduce lag.
- Weighted Moving Average (WMA): Gives more importance to recent prices, ideal for faster market environments.
- Wilder's Moving Average: Useful in certain volatility conditions, particularly in long-term strategies.
- Triangular Moving Average (TMA): Gives equal weight to both ends of the data, smoothing out short-term fluctuations.
- Volume-Weighted Moving Average (VWMA): Averages prices with consideration of volume, useful when price movements are heavily influenced by trade size.
- The strength of the Marker Indicator lies in its variety of smoothing methods. Traders can choose from different types of averages to tailor the indicator to current market conditions:
- Smoothing Functions for Precision:
- In addition to the variety of moving averages, the Marker Indicator also includes advanced smoothing methods to refine signals:
- Polynomial Smoothing: This technique smooths out short-term fluctuations and highlights the larger trend.
- Laguerre Smoothing: Allows traders to filter out market noise and get clearer signals in volatile markets. It can be customized further using the Gamma parameter (default at 0.4), providing even more control over how quickly the indicator responds to price changes.
- In addition to the variety of moving averages, the Marker Indicator also includes advanced smoothing methods to refine signals:
- Demand and Supply Levels:
- The Marker Indicator defines two key zones—Demand Level (default set to 30) and Supply Level (default set to 70):
- A bullish signal is triggered when the Marker Indicator falls below the demand level, indicating a possible reversal to the upside.
- A bearish signal is generated when it rises above the supply level, signaling a potential market decline.
- These levels are also visually marked on the chart, making it easy to spot reversal points and make informed trading decisions.
- The Marker Indicator defines two key zones—Demand Level (default set to 30) and Supply Level (default set to 70):
- Visual Alerts for Trend Reversals:
- The Marker Indicator doesn’t just rely on numerical data. It provides visual alerts for potential reversals, using color-coded zones and shading to highlight areas where bullish or bearish reversals are most likely to occur.
- These visual cues include an overlay of supply and demand zones using customizable color schemes, making it easier to interpret the data at a glance.
How to Use the Marker Indicator in Trading
The Marker Indicator is designed to be versatile, making it suitable for a variety of trading styles:
- Bullish Reversals: When the indicator dips below the 30 level, it indicates a potential bullish reversal. This is an ideal time to consider entering a long position.
- Bearish Reversals: When the indicator crosses above the 70 level, it suggests a bearish reversal, signaling that it may be time to exit a long position or enter a short position.
- Trend Following: For traders who prefer to ride market trends, the Marker Indicator’s smoothing methods and lookback flexibility help reduce market noise, allowing you to stay in profitable trades longer without reacting to short-term price fluctuations.
Why Choose the Marker Indicator?
With its combination of customizable lookback periods, multiple smoothing techniques, and clear visual alerts, the Marker Indicator stands out as a decent tool for predicting trend reversals. Whether you’re a day trader looking for quick entries and exits, or a swing trader focused on larger market movements, the Marker Indicator gives you the flexibility to make informed trading decisions.
Review the screenshots and video for setup options.
Click here for a list of all of NinjaTrader's Downloads.
Screenshots
Media