
sharp vision traders
Enhancing Your Trading Experience

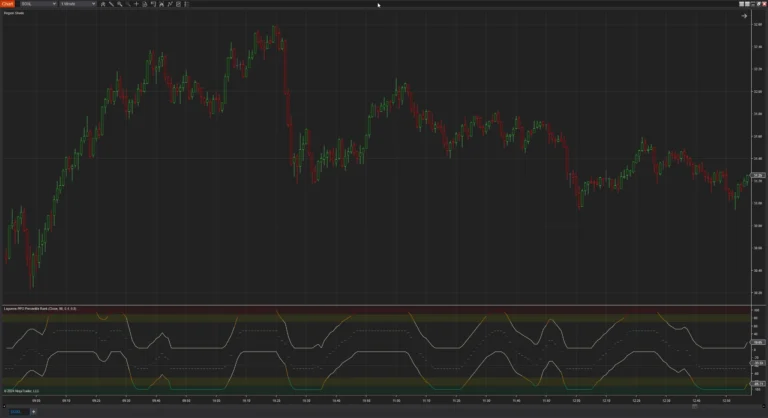
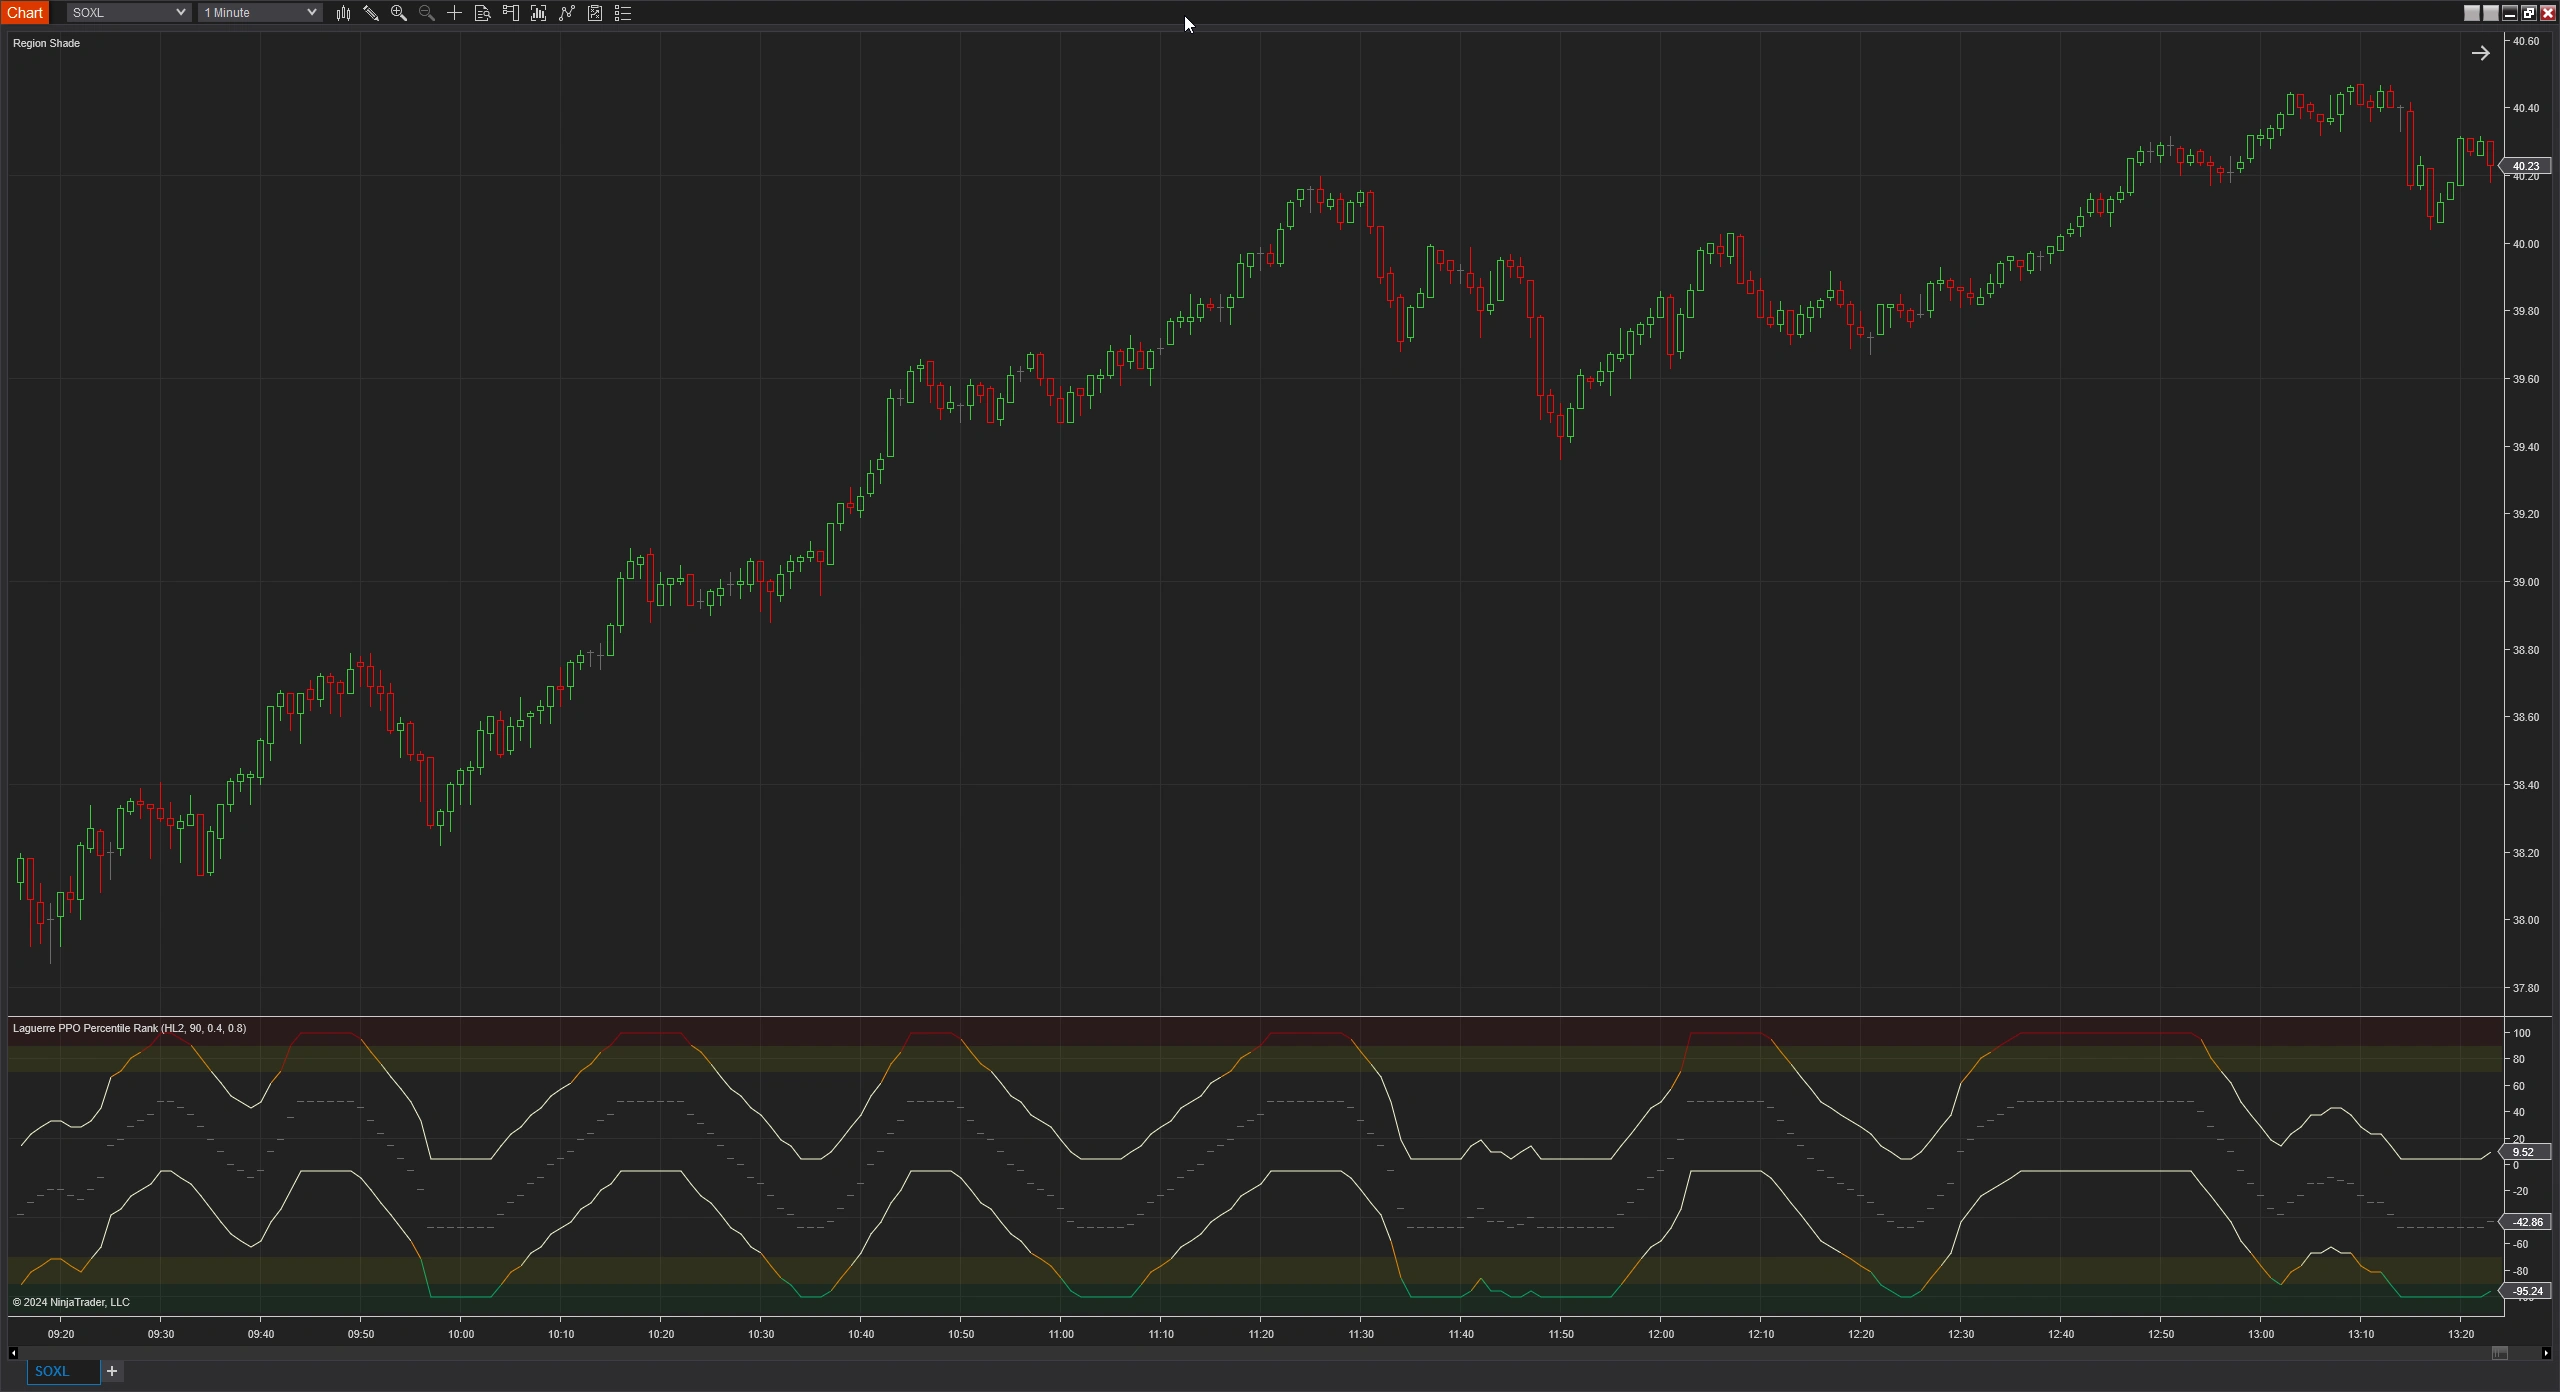
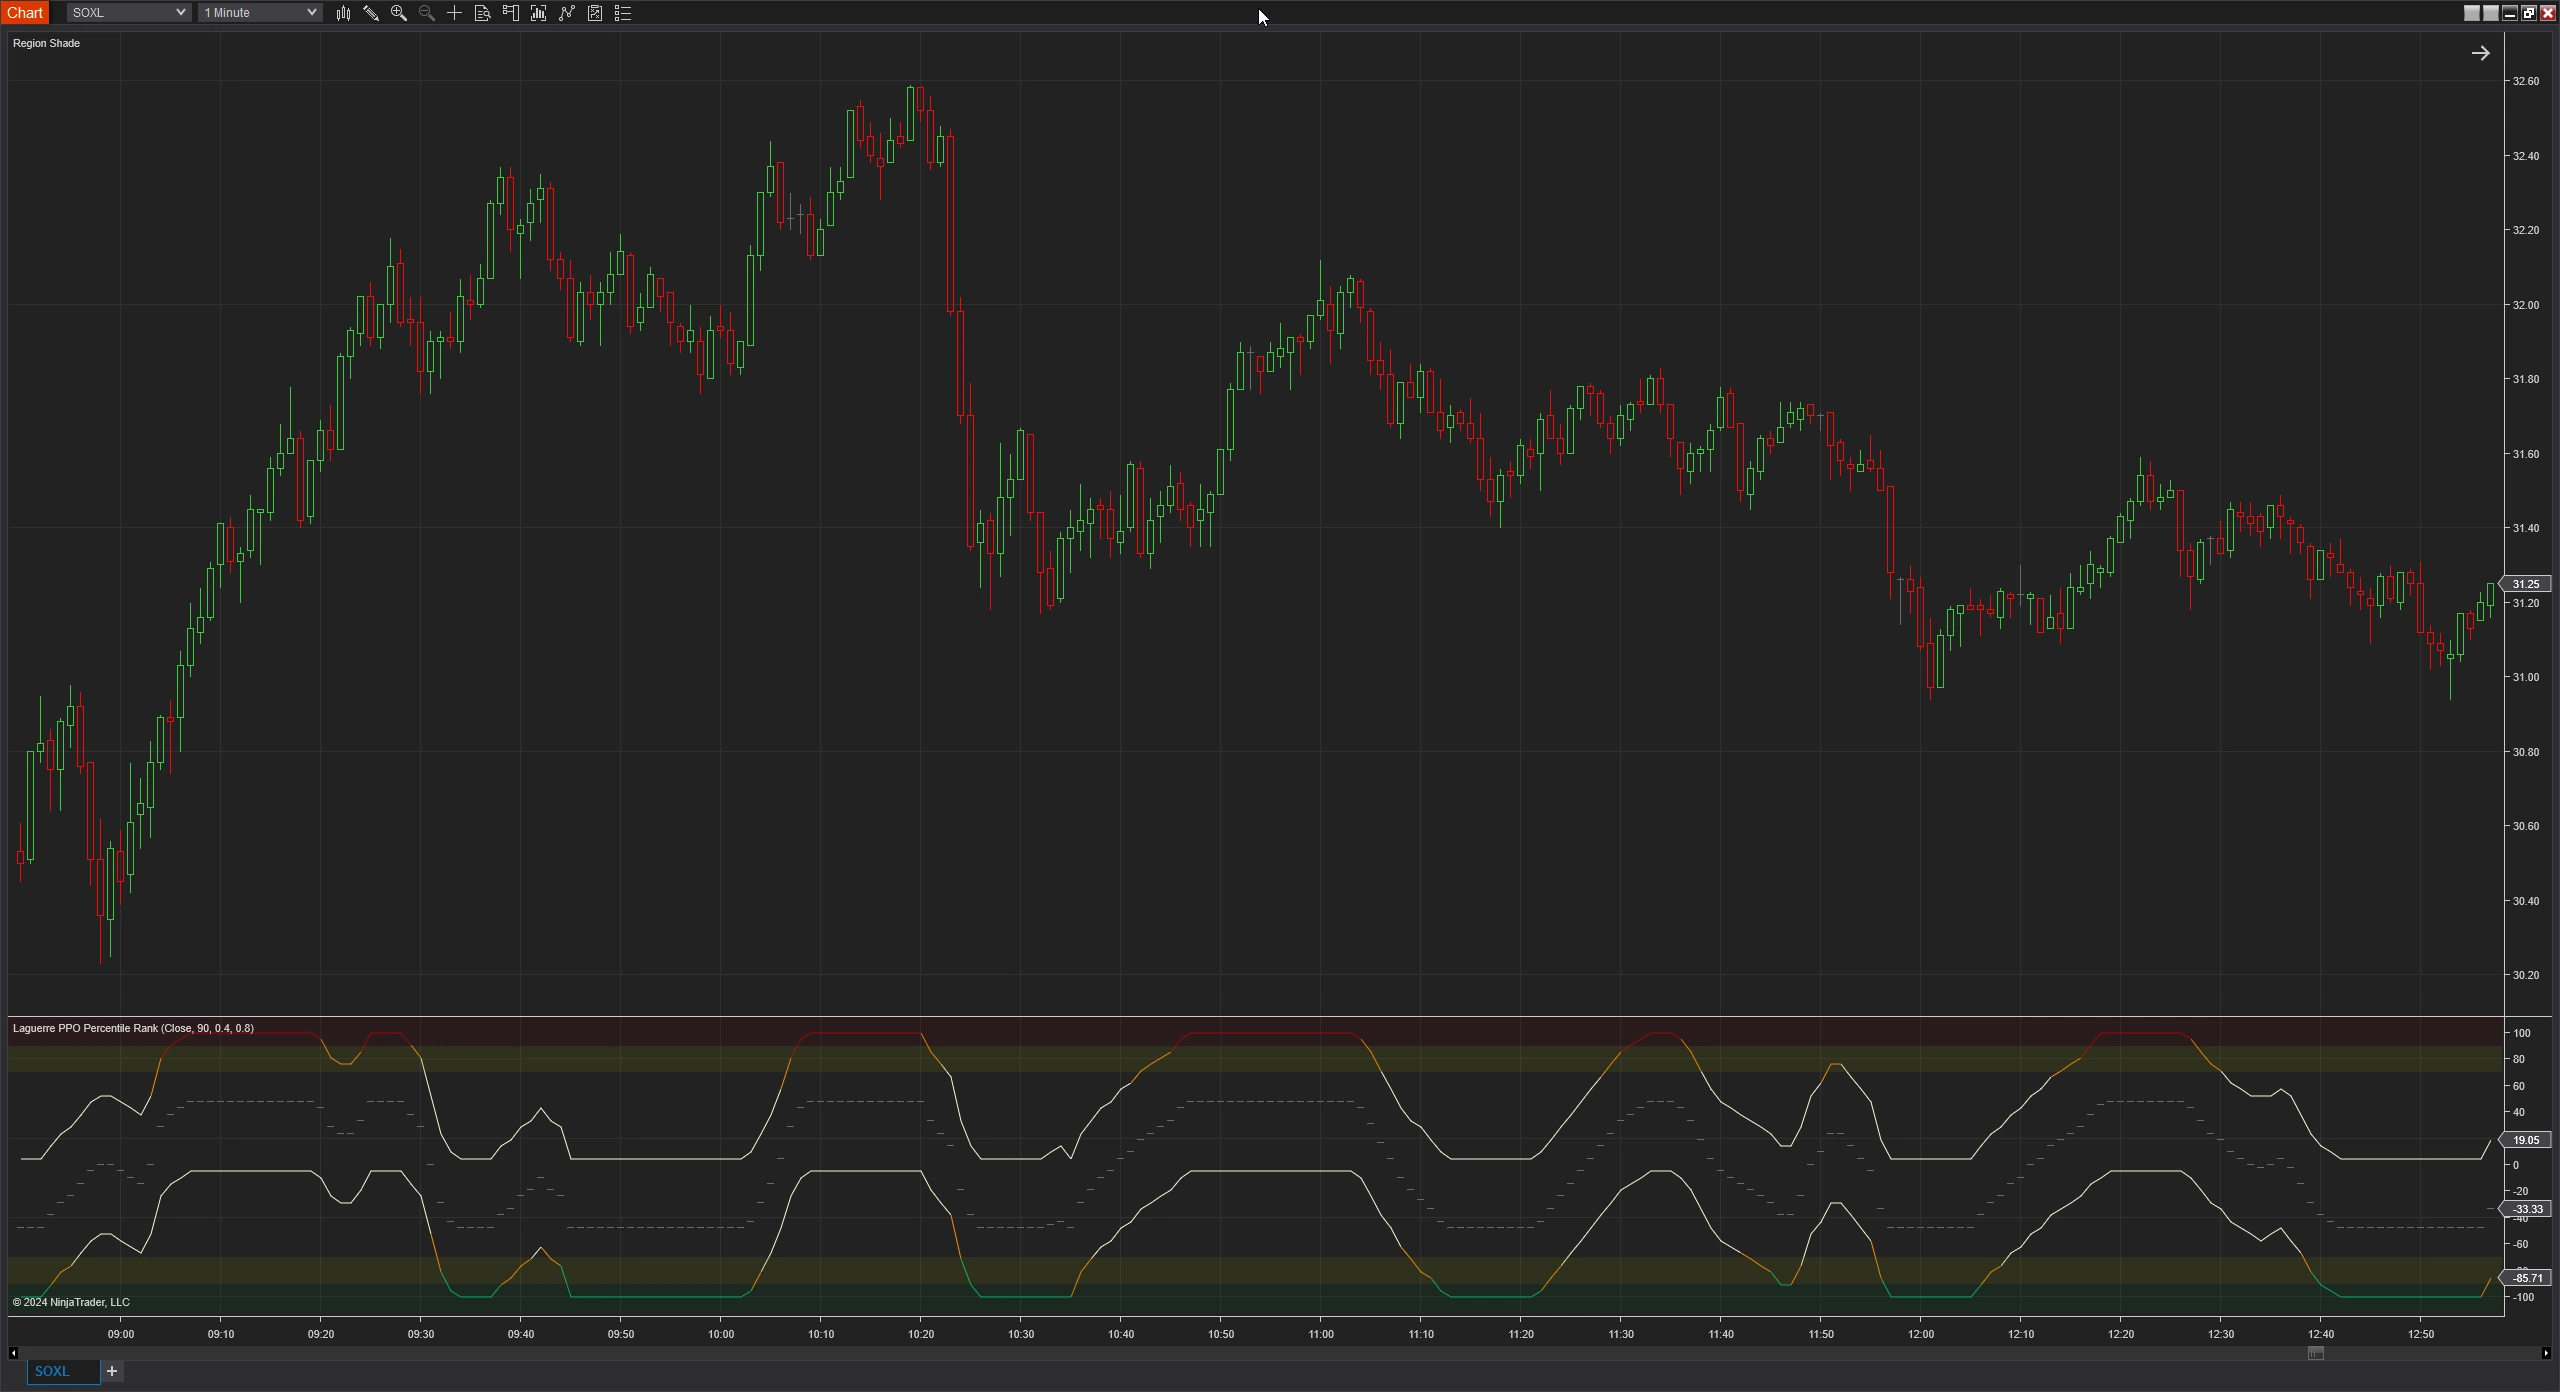
Laguerre PPO Percentile Rank (NT)
- Categories: Indicator, NinjaTrader
- Tags: Ehlers, Laguerre, Oscillator
- Type: Free
The Laguerre PPO Percentile Rank for NinjaTrader is an indicator that combines elements of the Laguerre filter and the Percentage Price Oscillator (PPO) that delivers a refined measure of tops and bottoms.
Note: This download requires NinjaTrader 8 release 8.1.3 or newer.
Introduction to Laguerre PPO Percentile Rank
The Laguerre PPO Percentile Rank for NinjaTrader is an indicator that combines elements of the Laguerre filter and the Percentage Price Oscillator (PPO) that delivers a refined measure of tops and bottoms.
- Laguerre Filter: The Laguerre filter, developed by John Ehlers, is a type of smoothing filter that reduces lag and enhances the responsiveness of indicators. It achieves this by emphasizing recent price data while effectively minimizing noise from older data points.
- Percentage Price Oscillator (PPO): The PPO is a momentum oscillator that measures the difference between two moving averages of price, expressed as a percentage. It is similar to the Moving Average Convergence Divergence (MACD) but scales the difference by the larger moving average, making it useful for comparing price momentum.
- This indicator is particularly effective in identifying when the market is approaching a potential top or bottom. In other words, if a trader entered at the beginning of start of a momentum pointing up or down, the indicator can help signal the optimal exit point.
- Identifying Overbought/Oversold Conditions: High percentile ranks can signal overbought conditions, suggesting that a market pullback or reversal may be imminent. Conversely, low percentile ranks can indicate oversold conditions, potentially signaling a buying opportunity.
Key Features of Laguerre PPO Percentile Rank
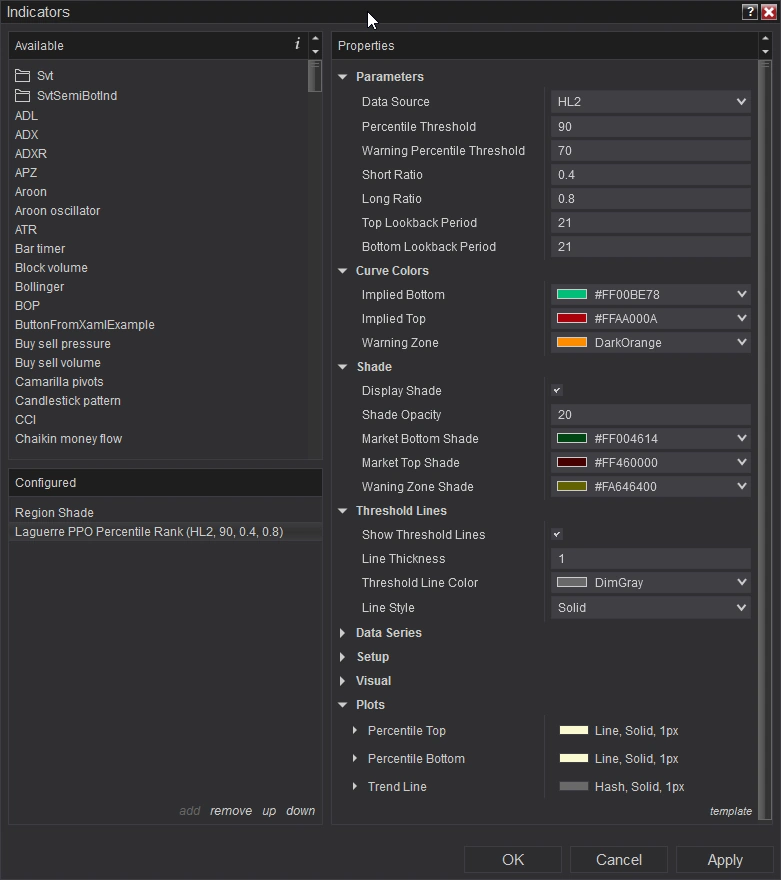
The indicator you're working with has several customizable properties that allow traders to tailor its performance to their specific needs. Below is an explanation of the features based on the properties provided in your code:
1. Data Source Customization:
- Allows you to select the data source that the indicator will use. It provides flexibility in analyzing different price inputs, ensuring that the indicator is working with the most relevant data for your strategy.
2. Percentile Threshold Settings
- Percentile Threshold: This setting determines the threshold for designating a market top or bottom. By adjusting this value (within a range of 1 to 99, with a default of 90), you can define what percentage of historical data should be considered extreme.
- Warning Percentile Threshold: This is a secondary threshold used for issuing warnings as the price nears the designated percentile threshold. It helps in providing early alerts, enabling traders to prepare for potential market turning points before they actually occur. This value must be lower than the primary percentile threshold.
3. Price Percentage Oscillator Ratios
- Short Ratio: This property sets the threshold for the short side of the Price Percentage Oscillator (PPO). It defines the sensitivity of the oscillator when identifying potential bearish trends.
- Long Ratio: Similarly, this property sets the threshold for the long side of the PPO. It adjusts how the indicator responds to bullish trends.
4. Lookback Periods for Top and Bottom Analysis
- Top Lookback & Bottom Lookback: These properties define the lookback periods for identifying potential tops and bottoms in the market. By adjusting these periods (ranging from 1 to 256, with a default of 21), traders can control how much historical data is considered when determining market extremes. This flexibility allows for a more or less sensitive analysis depending on market conditions.
5. Visual Customization
- Market Top Brush & Market Bottom Brush: These properties allow traders to customize the color used to indicate implied tops and bottoms on the chart. This visual distinction makes it easier to quickly identify critical points in the market.
- Warning Zone Brush: The warning zone is highlighted with a specific color, making it clear when the price is approaching the predefined warning threshold.
6. Shading Options
- Display Shade: This option enables or disables shading on the chart, adding a visual layer to emphasize important zones such as market tops, bottoms, or warning areas.
- Shade Opacity: The opacity level of the shading can be adjusted (from 1 to 100, with a default of 20) to ensure that it is prominent enough to be noticed without obscuring other important chart details.
- Bottom Shade Brush & Top Shade Brush: These properties allow traders to customize the color of the shading for market bottoms and tops, respectively.
- Warning Zone Shade Brush: This property sets the color for shading the warning zone, helping to highlight areas where the market is nearing critical thresholds.
7. Threshold Lines
- Show Threshold Lines: This property toggles the display of threshold lines on the chart, which visually represent the percentile thresholds set for market tops and bottoms.
- Threshold Line Brush: Customize the color of these threshold lines to ensure they stand out on your chart.
- Line Thickness & Line Style: Adjust the thickness and style of the threshold lines, giving you control over how prominently they are displayed. This can be particularly useful for aligning the indicator's visual elements with your chart's overall design.
Review the screenshots and video for setup options.
Click here for a list of all of NinjaTrader's Downloads.
Screenshots
Media