
sharp vision traders
Enhancing Your Trading Experience

Klinger Histogram (NT)
- Categories: Indicator, NinjaTrader
- Tags: Histogram, Volume
- Type: Free
The Klinger Histogram for NinjaTrader is a volume-based oscillator that compares the up and down volume flowing through an instrument with the price movements resulting in an oscillator.
Note: This download requires NinjaTrader 8 release 8.1.3 or newer.
Introduction to Klinger Histogram
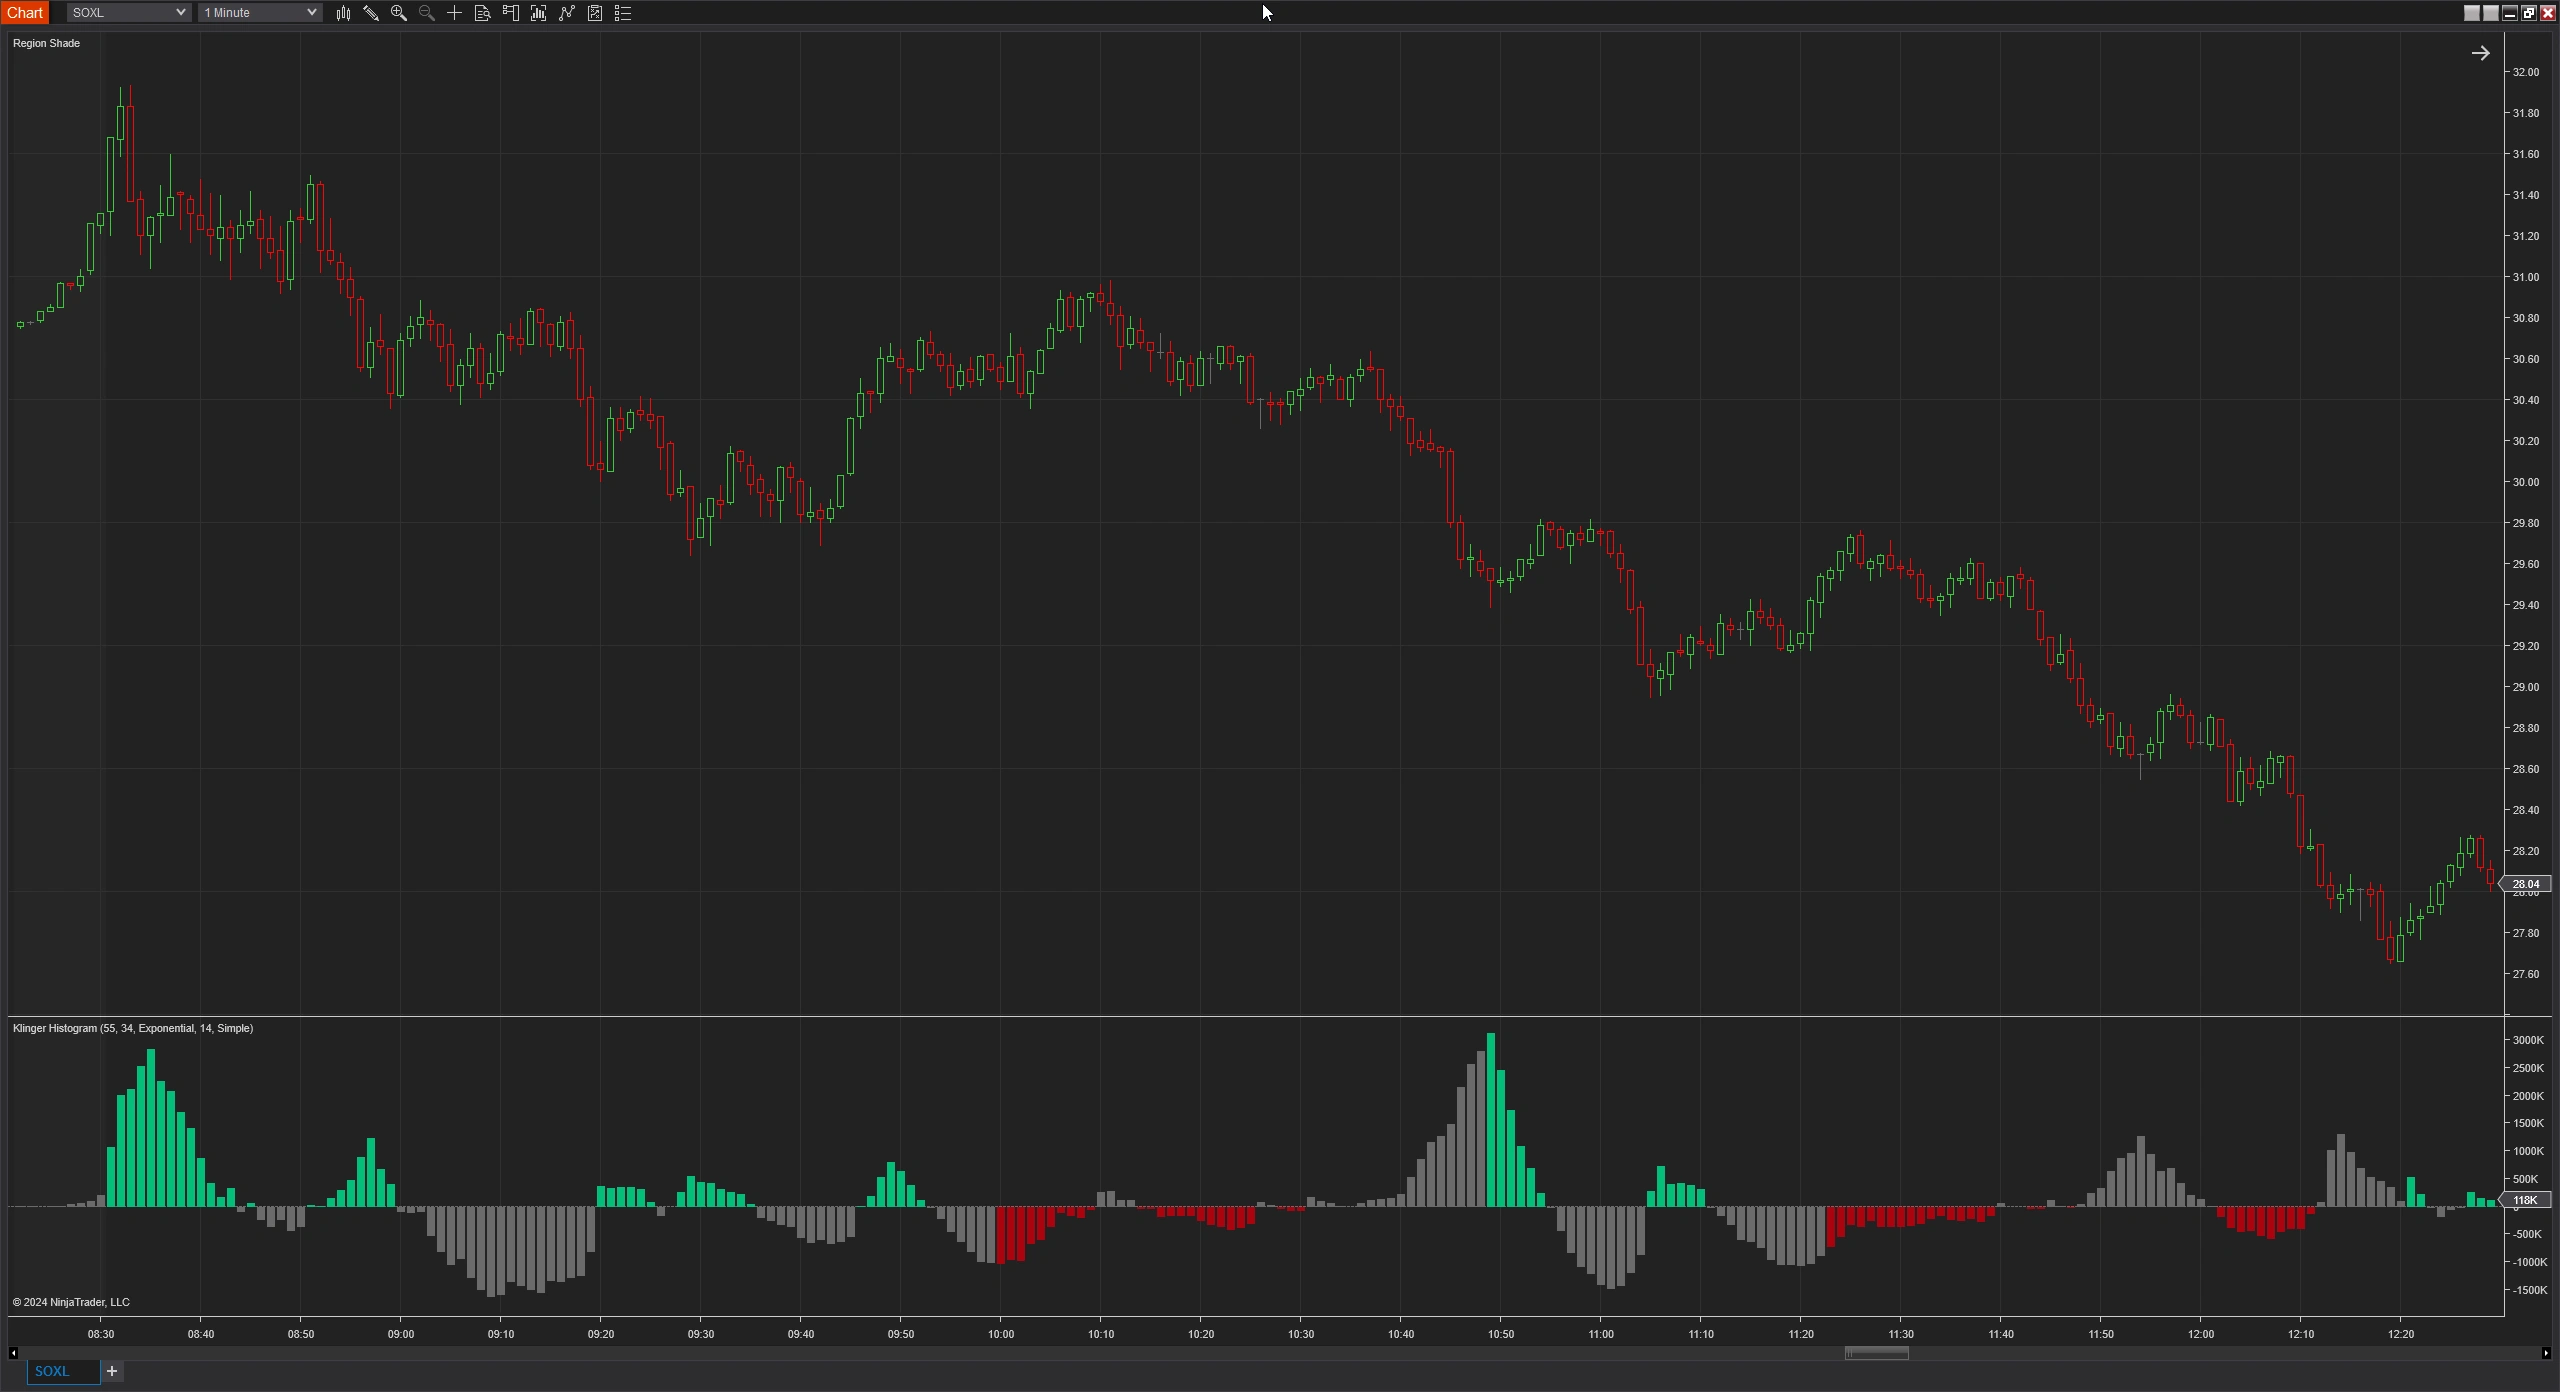
Introduced by Stephen Klinger, the Klinger Histogram for NinjaTrader is a volume-based oscillator that compares the up and down volume flowing through an instrument with the price movements resulting in an oscillator. This indicator is designed to detect and forecast long-term money flow trends while remaining responsive to short-term changes. As a trend-following tool, it seeks to identify potential price reversals in advance by pinpointing divergences between volume and price movements. The oscillator for this indicator is converted to a histogram for convenience.
A bullish indication occurs when the Klinger Histogram line moves above the signal line, while a bearish indication arises when the Histogram line dips below the zero line. These crossovers typically anticipate shifts in price direction, offering early opportunities to enter potential market movements. Discrepancies between the Klinger Histogram and price trends can signal possible market reversals, and recognizing these early can lead to favorable entry and exit points for trades.
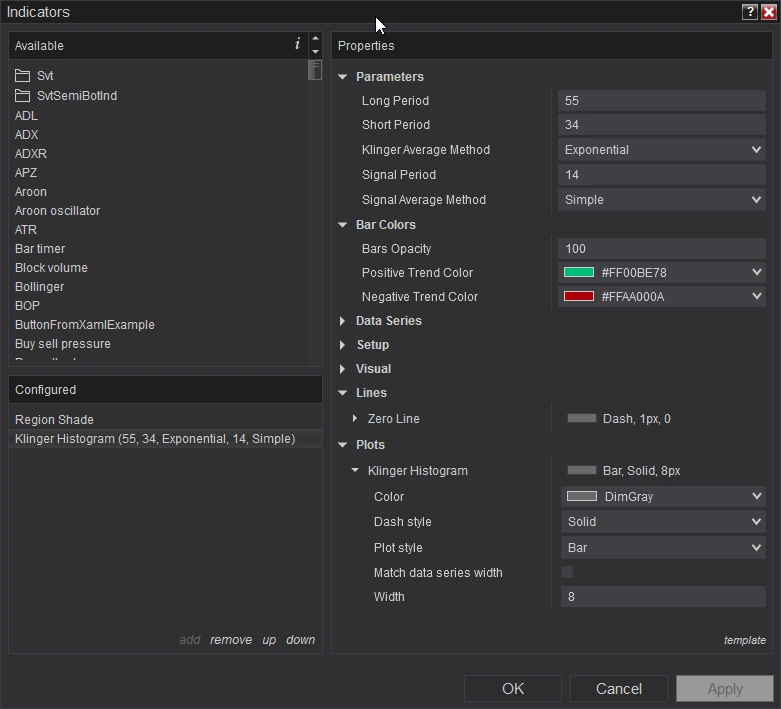
Key Features of Klinger Histogram
- The user will have the option to customize internal moving averaging method and the signal moving averaging method.
- The user will also have the option to customize the periods.
Review the screenshots and video for setup options.
Click here for a list of all of NinjaTrader's Downloads.

Screenshots
Media