
sharp vision traders
Enhancing Your Trading Experience

Kaufman Binary Wave (NT)
- Categories: Indicator, NinjaTrader
- Tags: Momentum, Oscillator, Stochastic, Trend
- Type: Free
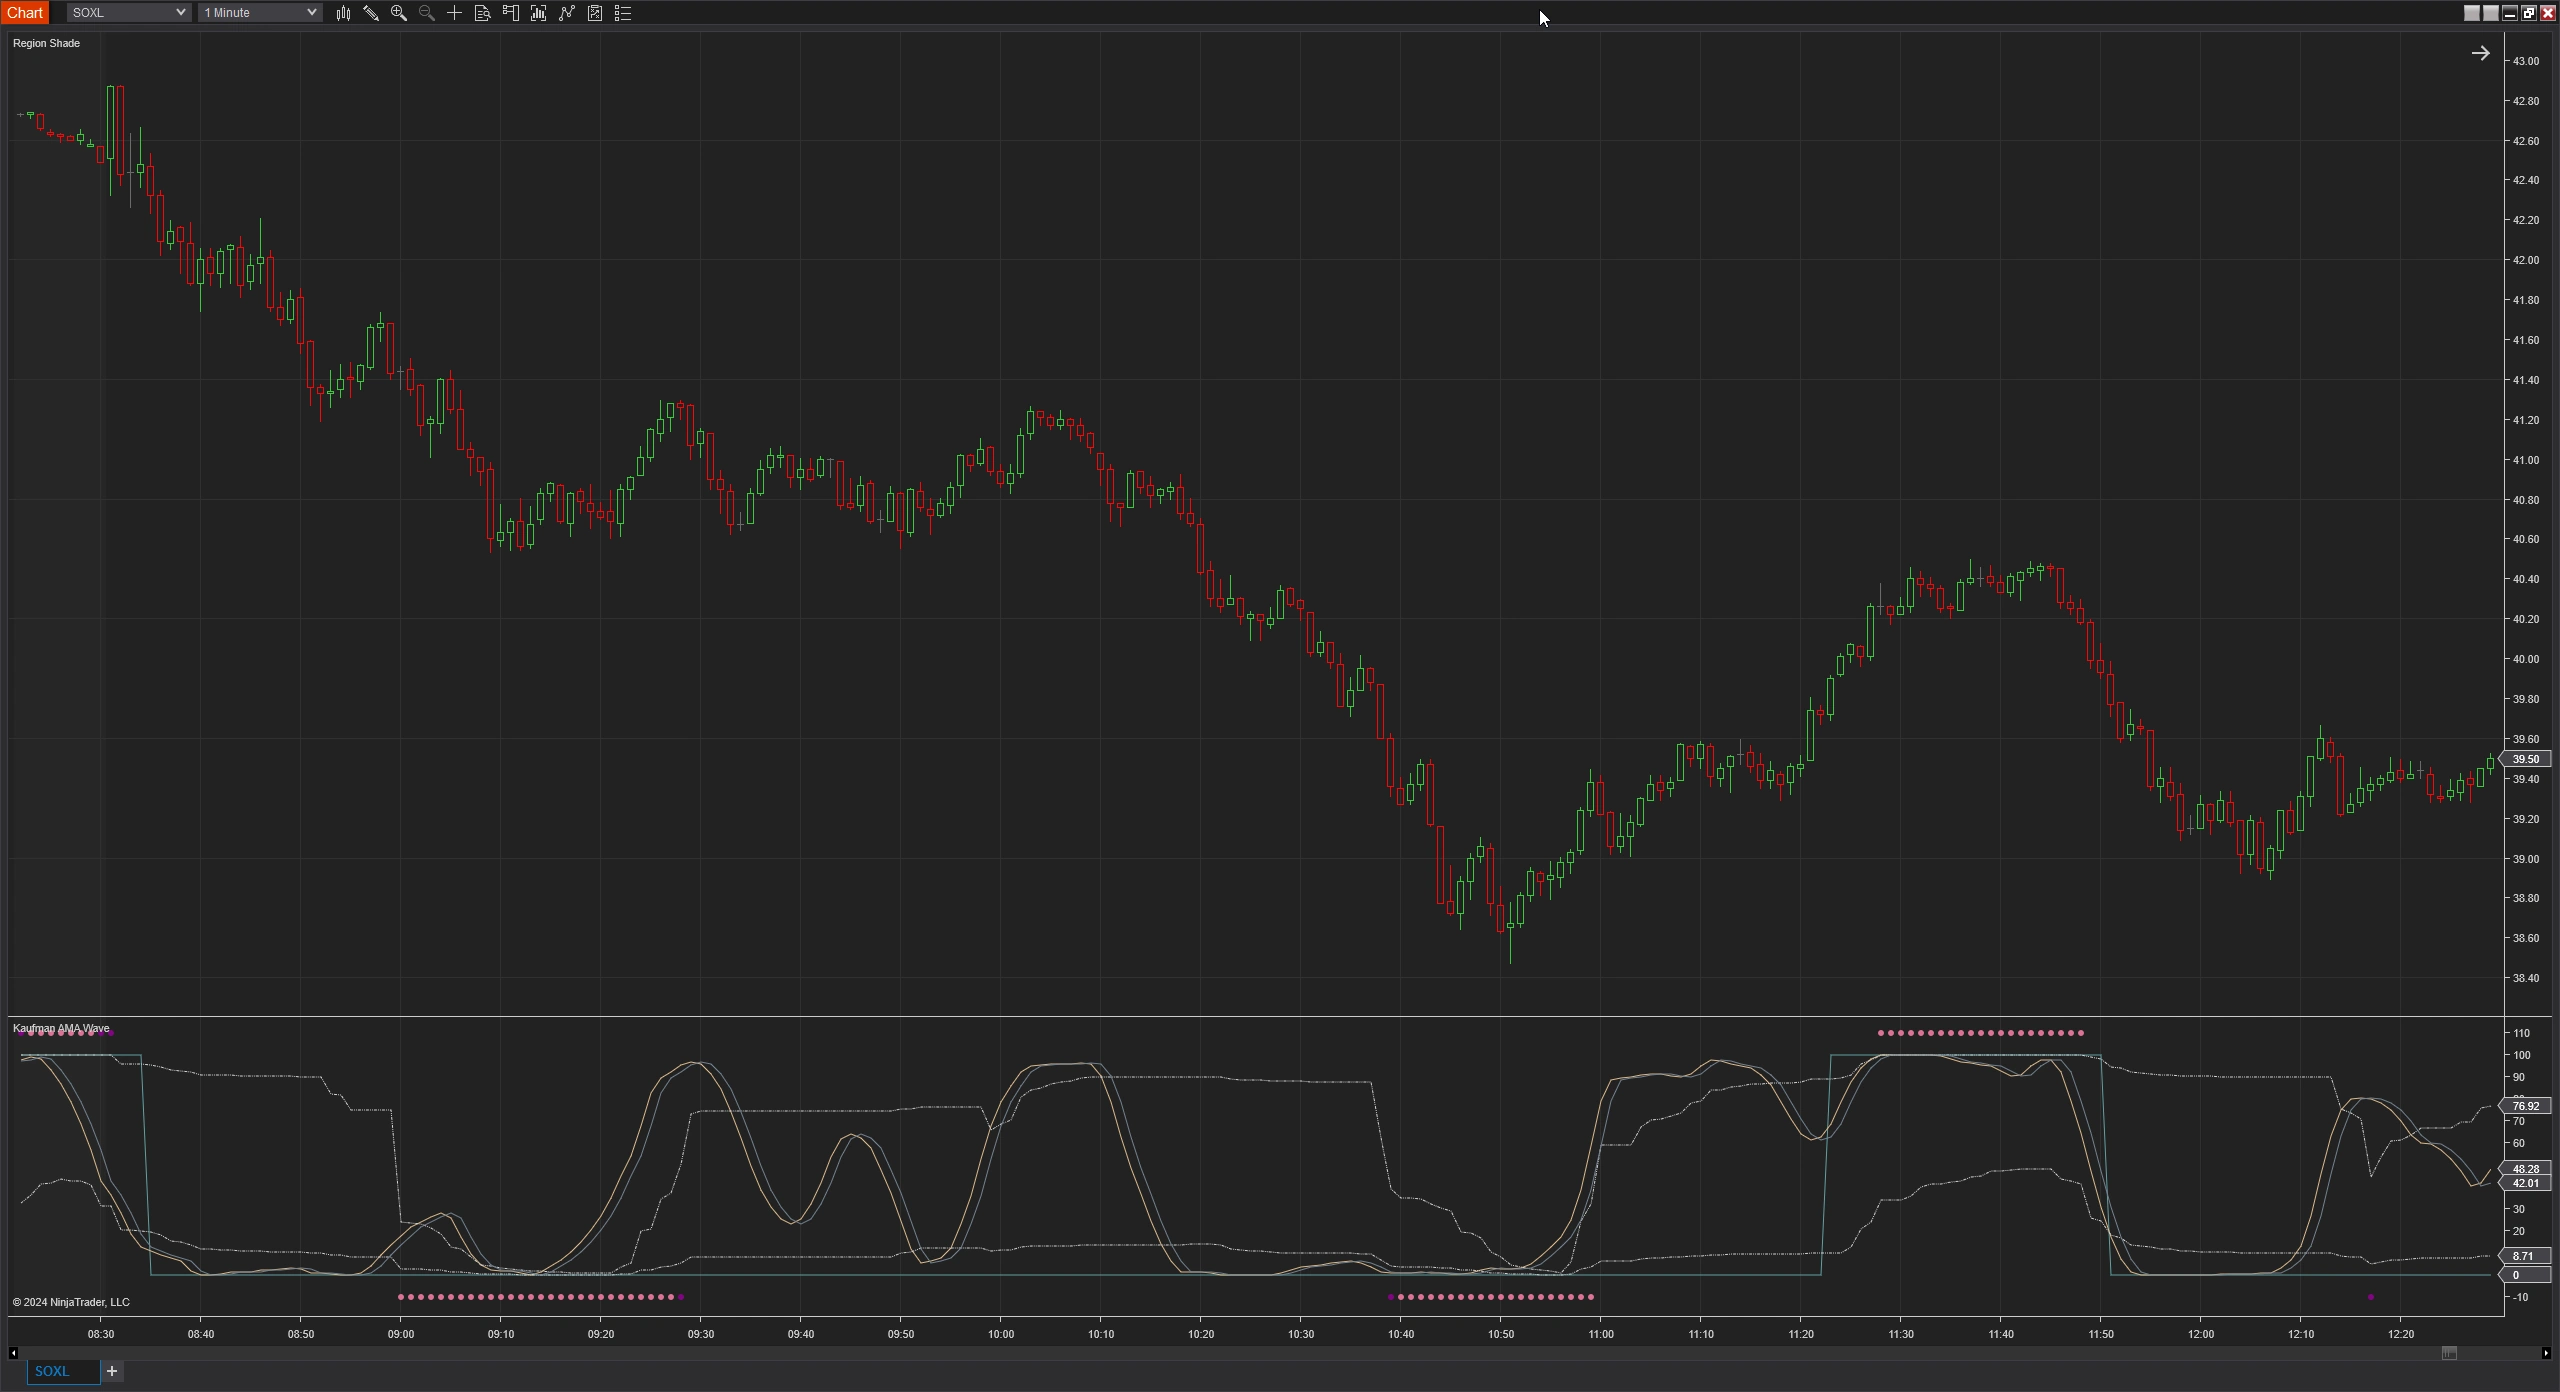
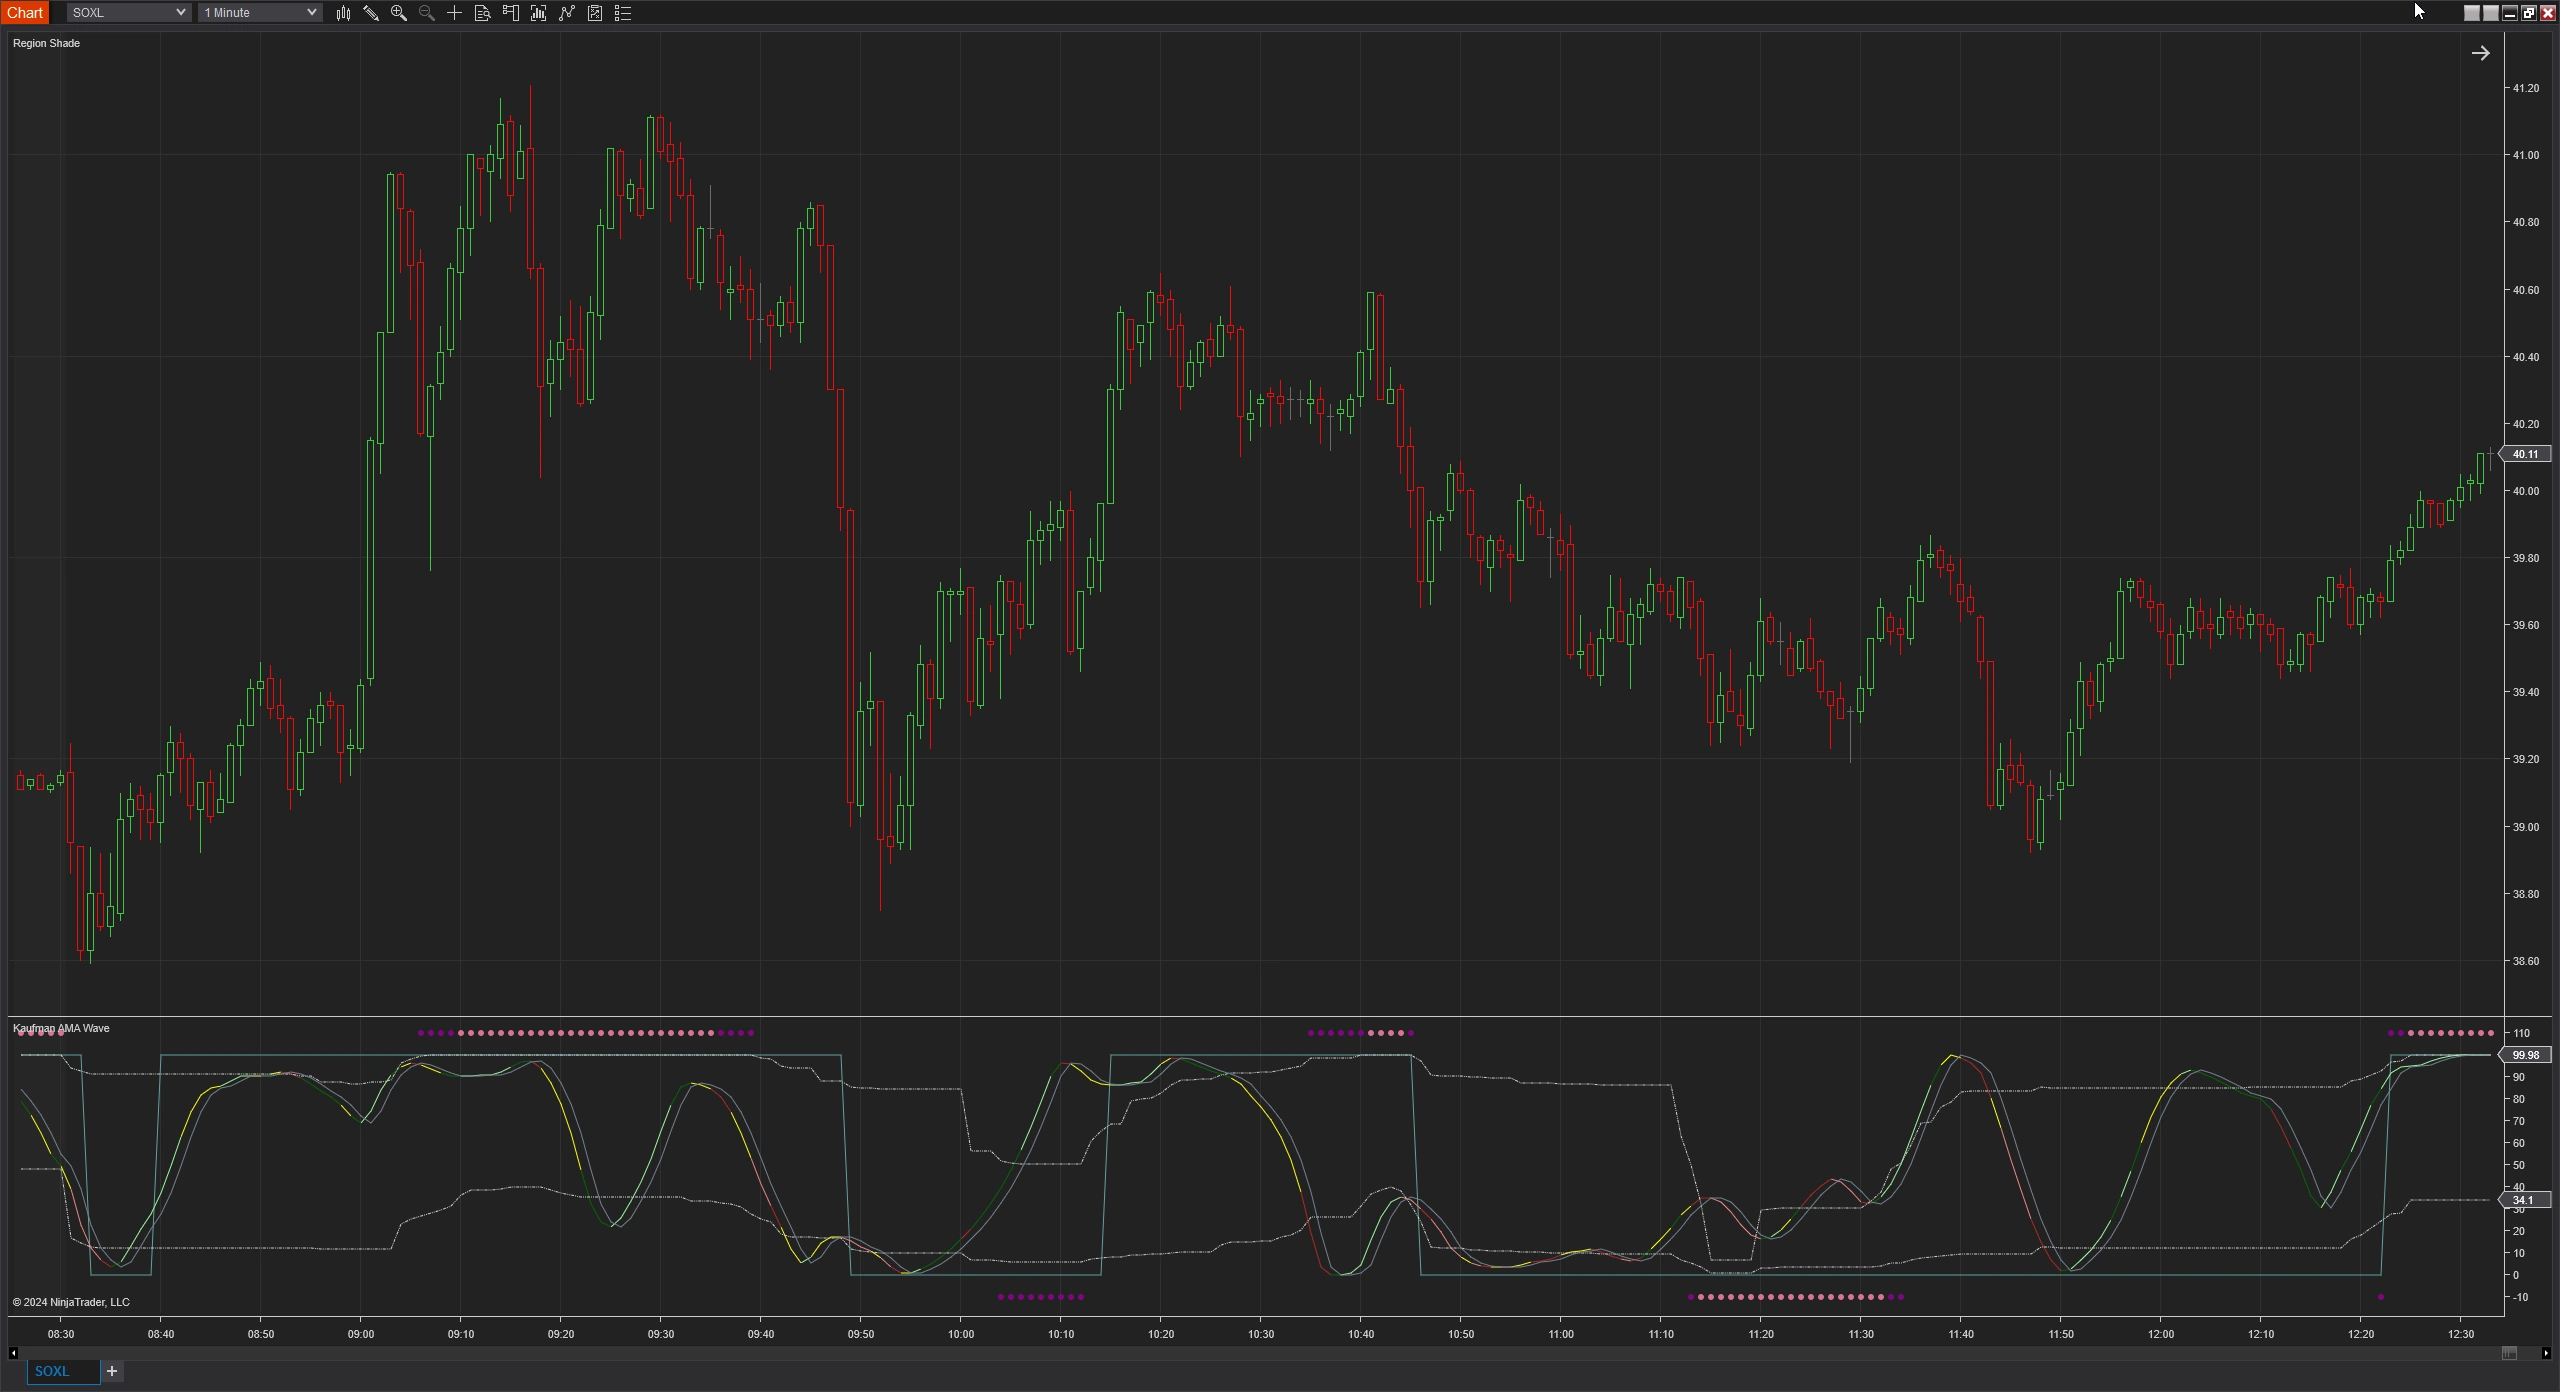
The Kaufman Binary Wave for NinjaTrader study combines overall trend identification with momentum, directional squeeze, and oversold and overbought zones.
Note: This download requires NinjaTrader 8 release 8.1.3 or newer.
Introduction Kaufman Binary Wave
The Kaufman Binary Wave for NinjaTrader study combines overall trend identification with momentum, directional squeeze, and oversold and overbought zones. The study is based on two popular indicators: namely Kaufman binary wave and Stochastic momentum measurement. However, the uniqueness lies in the utilization of adaptive moving averages, inclusion of Relative Strength index also known as RSI, and also a unique trend identification algorithm that uses adaptive RSI and super trend producing a trend leading indicator.
Understanding the SVT Kaufman AEMA Wave Indicator
The SVT Kaufman AEMA Wave Indicator is not just another trading tool; it is a multi-component system that provides a detailed analysis of market conditions. Let’s break down its key components:
1. Kaufman Binary Wave
At the heart of this indicator is the Kaufman Binary Wave. This component is used to determine whether the broad market is in an uptrend or downtrend. It works similarly to a standard Kaufman Binary Wave but with additional flexibility. Traders can adjust the filter, fast, and slow periods to better suit their trading style. The Binary Wave can also be used as an entry or exit point.
2. Stochastic Curve
The Stochastic Curve is included to help traders identify precise entry and exit signals. It typically leads the Kaufman Wave, providing early indications of potential market movements. When used in conjunction with the Kaufman Binary Wave, the combination becomes particularly helpful, allowing traders to time their trades based on broad market sentiment and structure.
3. Custom Leading Trend Indicator
This indicator goes beyond the basics to help traders determine the state of the short-term trend. It informs the trader of whether the trend is weakening or strengthening. The trend is calculated using a combination of adaptive relative strength index (RSI) measurements and a super trend. The trend's status is visually represented by coloring the main stochastic curve, offering an immediate insight into market conditions.
4. Directional Squeeze Function
The Directional Squeeze Function is a custom feature designed to confirm the trend and provide a powerful indication that the market is pushing in a certain direction. It alerts traders to potential breakout points, helping them to align their trades with the prevailing market trend.
5. Dynamic Oversold and Overbought Regions
Lastly, the study includes dynamic oversold and overbought regions. These regions are crucial for signal entry. For example, when the stochastic indicates an overbought condition in a downtrend market as per the Kaufman Wave, it signals that the price might push further down, suggesting a potential shorting opportunity. Conversely, an oversold condition in an uptrend signals a potential long entry. The coloring of the stochastic curve by the trend function further aids in confirming these entries.
Key Features of Kaufman Binary Wave
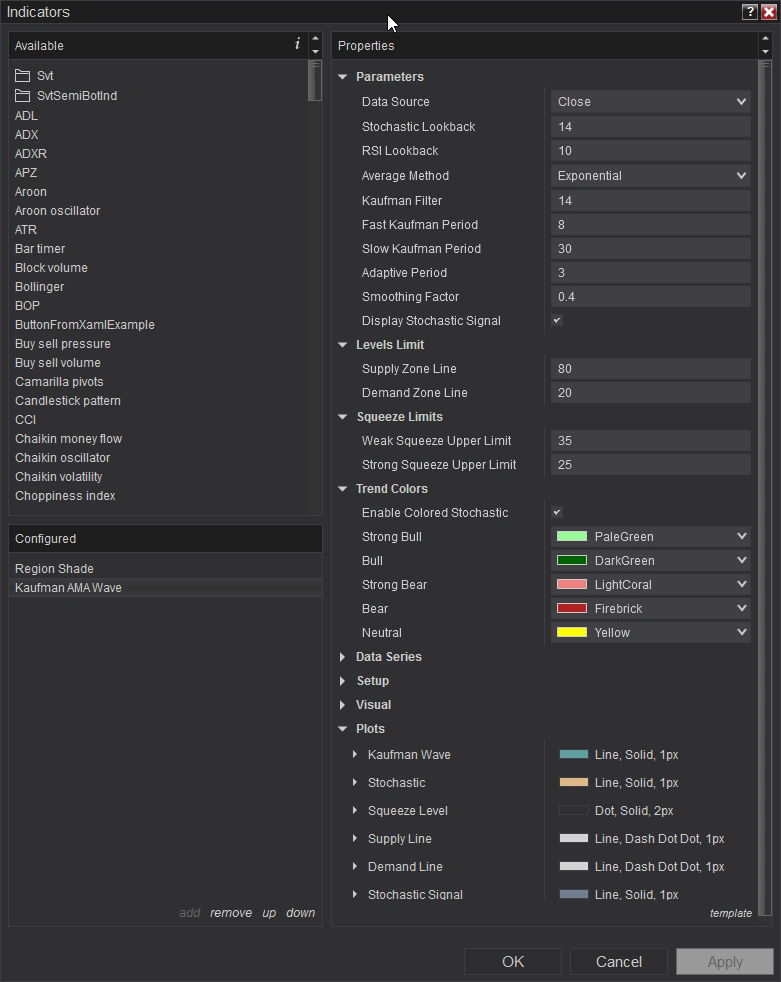
1. Customizable Data Inputs
- This indicator allows you to choose from various data sources, such as closing prices or average prices. This flexibility helps you tailor the indicator to suit your specific trading needs.
2. Adjustable Periods
- You can set the lookback periods for different components of the indicator, like the main trend and RSI. This lets you fine-tune how the indicator reacts to market movements, making it more responsive or smoother depending on your preference.
3. Adaptive Trend Analysis
- The study includes an adaptive component that adjusts to changing market conditions. This means the indicator can adapt to both slow and fast market environments, giving you a more responsive trend analysis.
4. Stochastic Signal Integration
- The indicator includes a stochastic curve that helps pinpoint entry and exit points. It often leads the market, providing early signals that can give you a trading edge.
5. Dynamic Overbought and Oversold Levels
- With customizable levels, the indicator helps you identify when the market is potentially overbought or oversold. This feature is crucial for timing your trades effectively, whether you're looking to buy low or sell high.
6. Directional Squeeze Detection
- The SVT Kaufman AEMA Wave can identify market squeezes—periods when volatility is low, but a breakout is likely. This feature alerts you to potential big moves in the market, helping you position yourself ahead of time.
7. Clear Trend Visualization
- The indicator visually represents market trends by coloring the stochastic curve. Whether the market is bullish, bearish, or neutral, the colors provide a quick, easy-to-understand view of the current market state.
Review the screenshots and video for setup options.
Click here for a list of all of NinjaTrader's Downloads.

Screenshots
Media