sharp vision traders
Enhancing Your Trading Experience

Jurik DMX (TS)
- Categories: Indicator, ThinkOrSwim
- Tags: Jurik, RSI
- Type: Priced
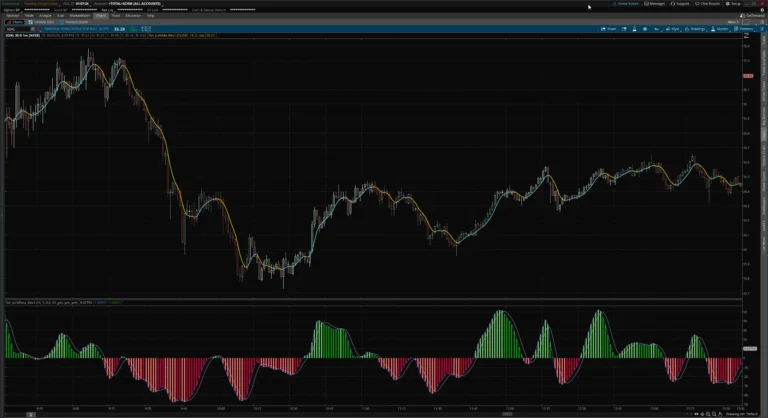
The Jurik DMX Indicator for ThinkOrSwim is an enhanced version of the traditional DMI, utilizing Jurik advanced smoothing algorithms.
Jurik DMX: Enhancing Trend Analysis with Advanced Smoothing and Divergence Detection
Identifying market trends and their strength is crucial for successful trading. One foundational tool that traders have relied upon is the Directional Movement Index (DMI), developed by J. Welles Wilder. While the DMI provides valuable insights, it can sometimes be susceptible to market noise and lag, leading to less precise signals.
The Jurik DMX addresses these limitations by incorporating advanced smoothing techniques and enhanced features, including divergence detection. This article delves into the Jurik DMX, explaining its functionalities and how traders can leverage its properties to make more informed decisions.
Understanding the Directional Movement Index (DMI)
The Directional Movement Index (DMI) is a momentum indicator that measures the strength and direction of a trend. It consists of two lines:
- +DI (Positive Directional Indicator): Measures the strength of upward price movements.
- -DI (Negative Directional Indicator): Measures the strength of downward price movements.
The DMI helps traders identify whether bulls or bears are in control and can signal potential trend changes when these lines cross.
Limitations of the Traditional DMI
While the DMI is valuable, it has some drawbacks:
- Sensitivity to Market Noise: Sudden price spikes or volatility can generate false signals.
- Lag: The indicator may react slowly to rapid market changes, causing traders to miss opportunities.
Introducing the Jurik DMX Indicator
The Jurik DMX with Divergence Indicator for ThinkOrSwim is an enhanced version of the traditional DMI, utilizing Jurik advanced smoothing algorithms. It aims to provide a more accurate and timely representation of market trends by reducing noise and minimizing lag.
Key Improvements
- Advanced Smoothing: Applies sophisticated mathematical techniques to filter out minor fluctuations.
- Adaptive Parameters: Adjusts calculations based on recent market activity to maintain responsiveness.
- Divergence Detection: Incorporates tools to identify divergences between price and indicator movements, signaling potential trend reversals.
Key Features of the Jurik DMX Indicator
Based on its implementation, the Jurik DMX offers several customizable features tailored to traders' needs.
1. Period Settings
- Period: Defines the baseline lookback period for the indicator's calculations.
- Smoothing Period: Sets the period for smoothing the indicator's output.
- Phase Adjustment:
- Range: -100 to 100 (Default: 0)
- Positive Values: Shift the indicator forward, anticipating future prices but risking more false signals.
- Negative Values: Shift the indicator backward, offering a conservative approach with reduced false signals but potentially slower reactions.
2. Jurik Average Length
- Sets the length for Jurik's adaptive moving average: Fine-tunes the balance between responsiveness and smoothness.
3. Display Options
- Show Trigger Curve: Enables or disables the display of the trigger line.
- Show Signal Curve: Enables or disables the display of the signal line.
- Show Histogram: Toggles the histogram display, which visualizes the difference between the trigger and signal lines.
- The indicator provides color customization for the histogram to enhance visual interpretation.
Interpreting the Jurik DMX Indicator
Understanding how to read the Jurik DMX is essential for applying it effectively.
Trigger and Signal Lines
- Trigger Line: Represents the difference between the smoothed positive and negative directional movements.
- Signal Line: A further smoothed version of the trigger line, acting as a reference.
Histogram
- The histogram visualizes the difference between the trigger and signal lines.
- Positive Histogram Bars:
- Strong Bullish: Trigger above signal and above zero.
- Bullish: Trigger below signal but above zero.
- Negative Histogram Bars:
- Strong Bearish: Trigger below signal and below zero.
- Bearish: Trigger above signal but below zero.
Trading Signals
- Buy Signal:
- Occurs when the histogram transitions from negative to positive.
- Confirmation is stronger if the trigger line crosses above the signal line.
- Sell Signal:
- Occurs when the histogram transitions from positive to negative.
- Confirmation is stronger if the trigger line crosses below the signal line.
Divergence Signals
- Bullish Divergence:
- Suggests a potential upward reversal.
- Look for price making lower lows while the indicator makes higher lows.
- Bearish Divergence:
- Indicates a possible downward reversal.
- Occurs when price makes higher highs but the indicator makes lower highs.
Configuring the Jurik DMX Indicator
Adjusting the indicator's settings can tailor it to specific trading strategies and market conditions.
Steps for Configuration
- Set the Period:
- Choose a period that balances responsiveness and smoothness based on your trading timeframe.
- Adjust the Smoothing Period:
- Modify to reduce noise without significantly delaying signals.
- Configure Divergence Settings:
- Enable divergence detection if you wish to identify potential reversals.
- Adjust the number of sets and strictness based on how much historical data you want to consider.
- Customize Visuals:
- Modify colors and styles for better readability.
- Set alerts for divergence signals to stay informed without constant monitoring.
- Test Different Settings:
- Backtest the indicator with various configurations to find what works best for your trading style.
Review the screenshots and video for setup options.
Check out a list of all of ThinkOrSwim Downloads.
Click here for installation instructions.

Screenshots
Media
