
sharp vision traders
Enhancing Your Trading Experience

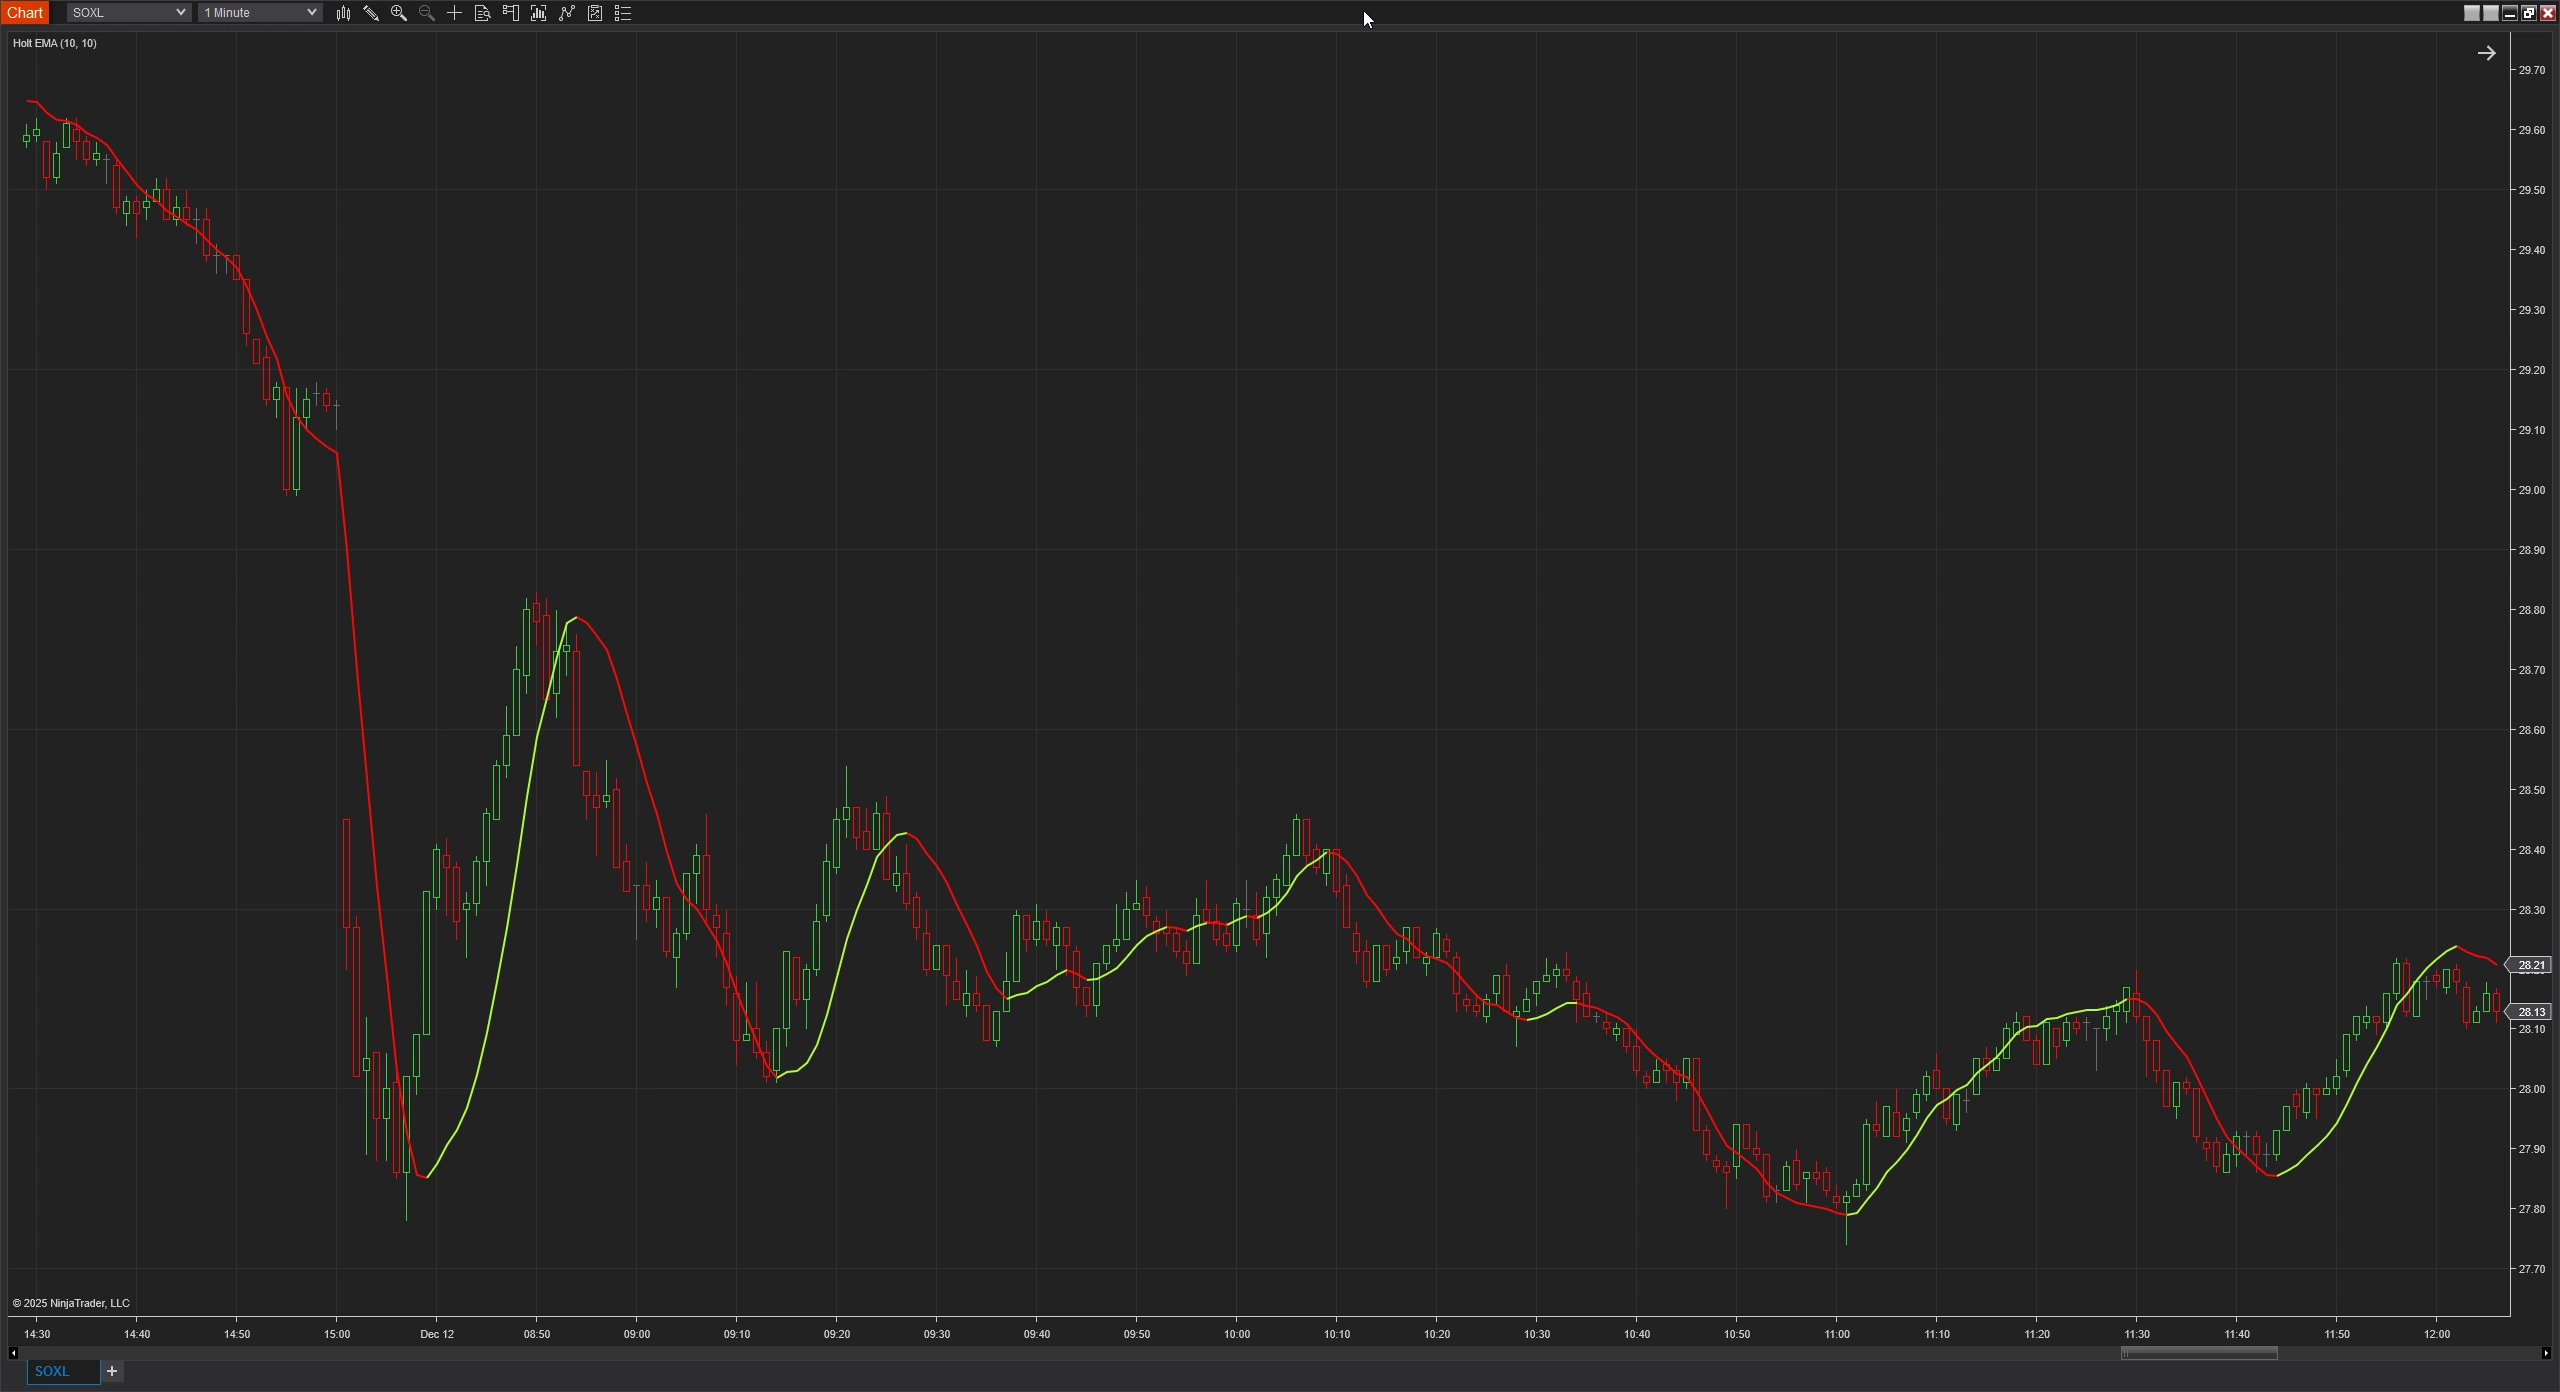
Holt EMA (NT)
- Categories: Indicator, NinjaTrader
- Tags: Moving Average, Trend
- Type: Free
The Holt EMA indicator for NinjaTrader is a technical tool designed to smooth price data and highlight trends using Holt’s linear trend method.
Note: This download requires NinjaTrader 8 release 8.1.3 or newer.
Introduction
The Holt EMA indicator for NinjaTrader is a technical analysis tool designed to smooth price data and highlight trends using Holt’s linear trend method. This indicator offers traders a way to visualize both the level and trend of an asset by applying a double exponential smoothing algorithm. By incorporating adjustable parameters for the smoothing factors—commonly referred to as alpha and gamma—the Holt EMA indicator adapts to market conditions and provides insight into potential trend changes.
History
Holt’s linear trend method, developed by Charles Holt in the late 1950s, was originally created for forecasting time series data that exhibit trends. Unlike traditional exponential moving averages that only smooth data based on level changes, Holt’s method introduces a trend component. This addition enables the method to respond not only to the current price level but also to its rate of change. Over time, this approach has been adapted into various trading indicators, including the Holt EMA, which is now used by traders to analyze market dynamics more effectively.
Features of the Holt EMA Indicator
The Holt EMA indicator, as implemented in the provided code, offers several key features:
1. Double Exponential Smoothing
Level and Trend Components:
The indicator uses a two-step calculation process. The first step computes a smoothed level value using a weighted combination of the previous level and the current data point. The second step estimates the trend (or slope) based on the difference between successive smoothed values.Smoothing Factors:
- Alpha (α): Acts as the smoothing factor for the level component. A higher alpha value increases the indicator's sensitivity to recent price changes.
- Gamma (γ): Serves as the smoothing factor for the trend component. A higher gamma value causes the trend component to react more quickly to changes in the data.
2. Flexible Data Input Options
The indicator allows traders to select various data sources for its calculations. Options include:
- Close price
- High, Low, Open, and their averages (e.g., HL2, HLC3, OLHC4)
- Volume Weighted Average Price (VWAP)
This flexibility enables users to tailor the indicator to specific market conditions or trading strategies.
3. Trend and Slope Display
Trend Display:
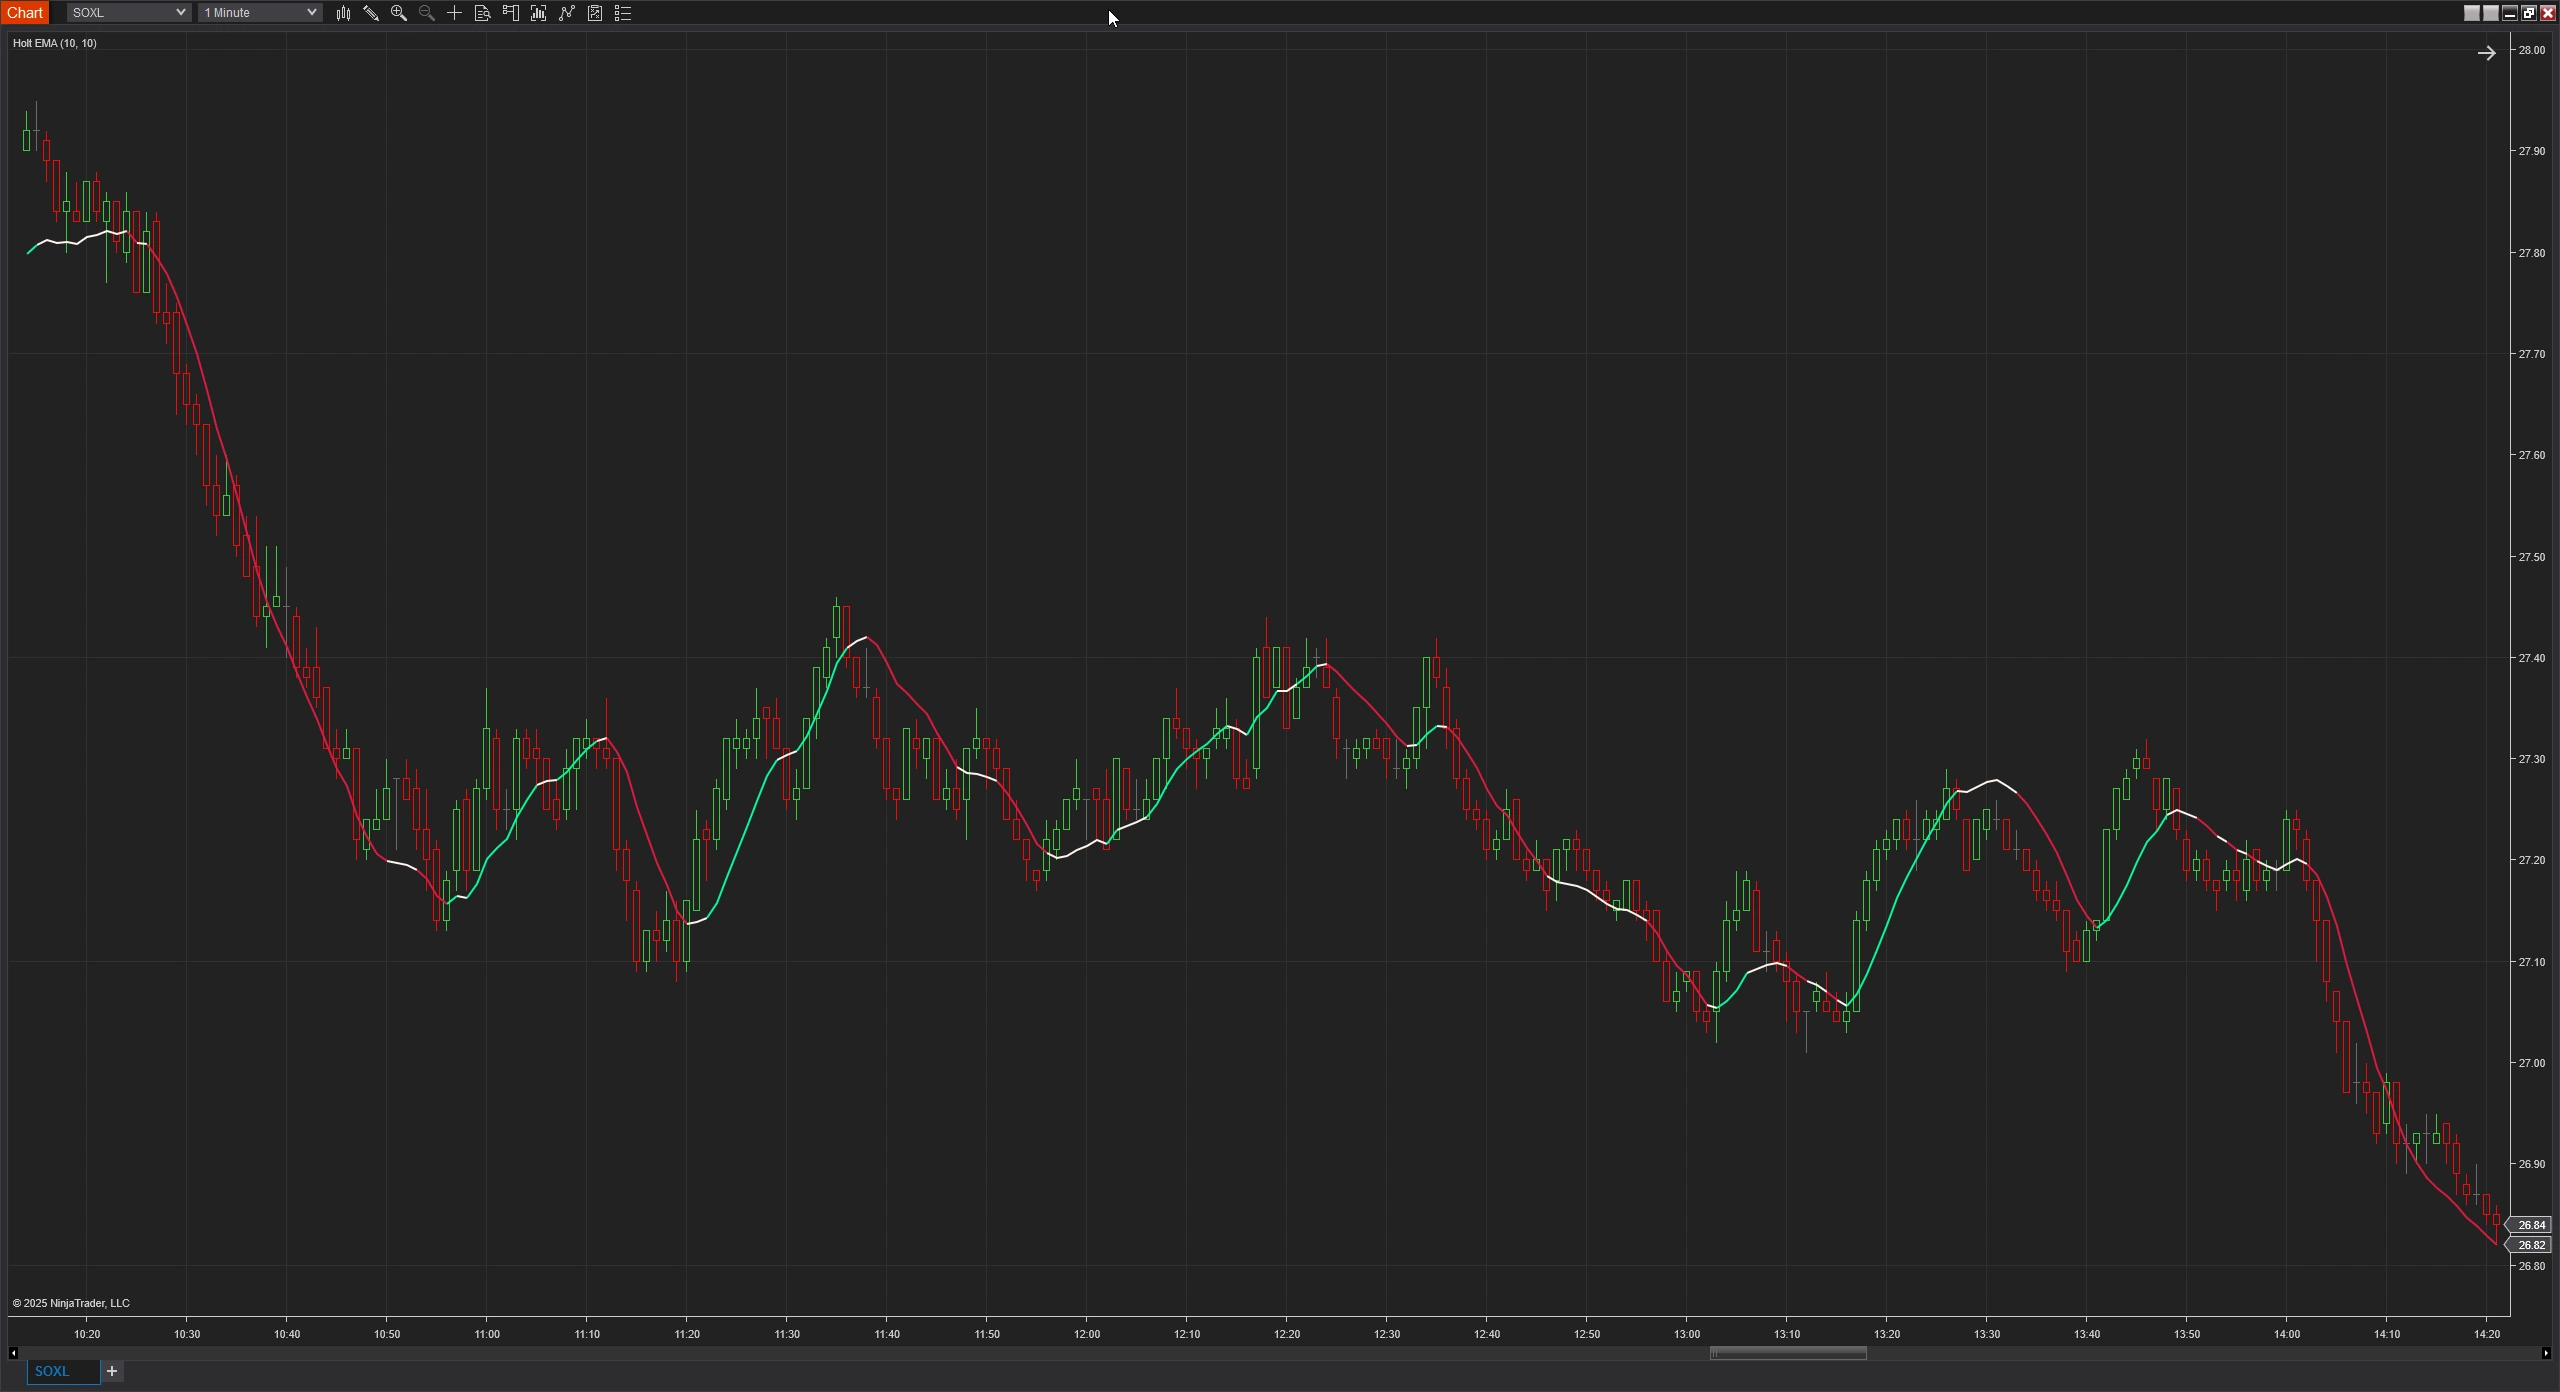
When enabled, the indicator colors the plotted line based on the trend direction. If the current smoothed value is higher than the previous value, the indicator uses a bullish color (configured as Bull Brush). Conversely, if the value is lower, it applies a bearish color (configured as Bear Brush).Slope Display:
An optional slope display feature enhances trend visualization. The slope is calculated using the arctangent of the difference between successive smoothed values (converted to degrees). If the calculated slope exceeds a defined threshold (or falls below its negative counterpart), the indicator adjusts the color accordingly. This provides an additional layer of trend confirmation, especially when the rate of change is significant.
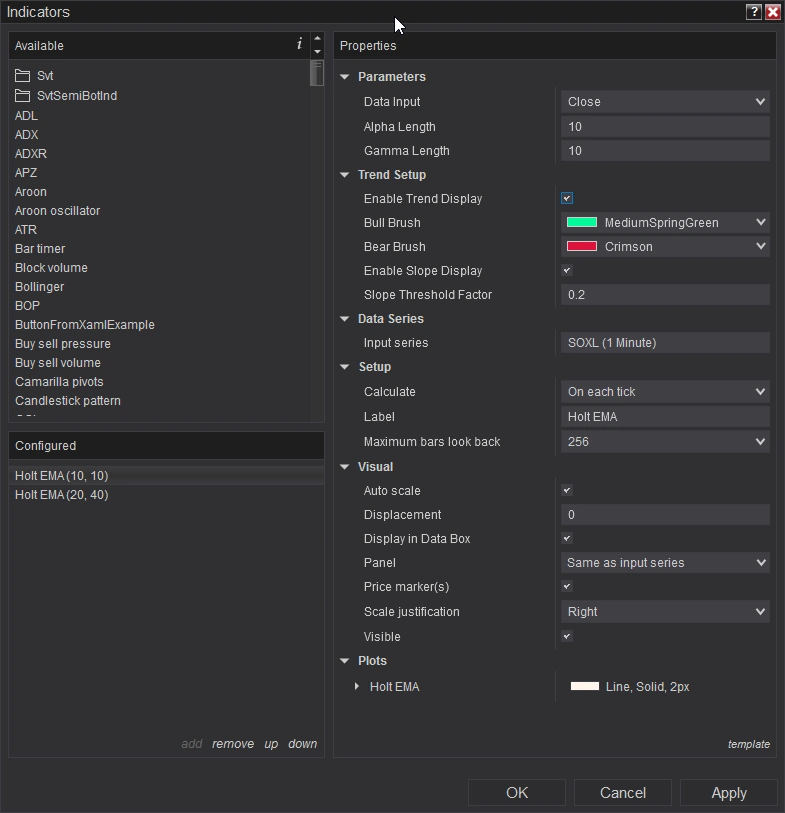
4. Customizable Parameters
- Alpha Length: Ranges from 1 to 256, with a default of 20. It determines the sensitivity of the level smoothing.
- Gamma Length:Ranges from 1 to 256, with a default of 40. It controls the responsiveness of the trend component.
- Slope Threshold Factor: With a range of 0.01 to 1.0 (default of 0.1), this parameter defines the minimum slope angle necessary to trigger a change in the indicator’s color display when slope display is enabled.
- Trend and Slope Display Options: Boolean settings allow users to enable or disable trend color changes and slope display features independently, giving traders full control over the indicator’s visual output.
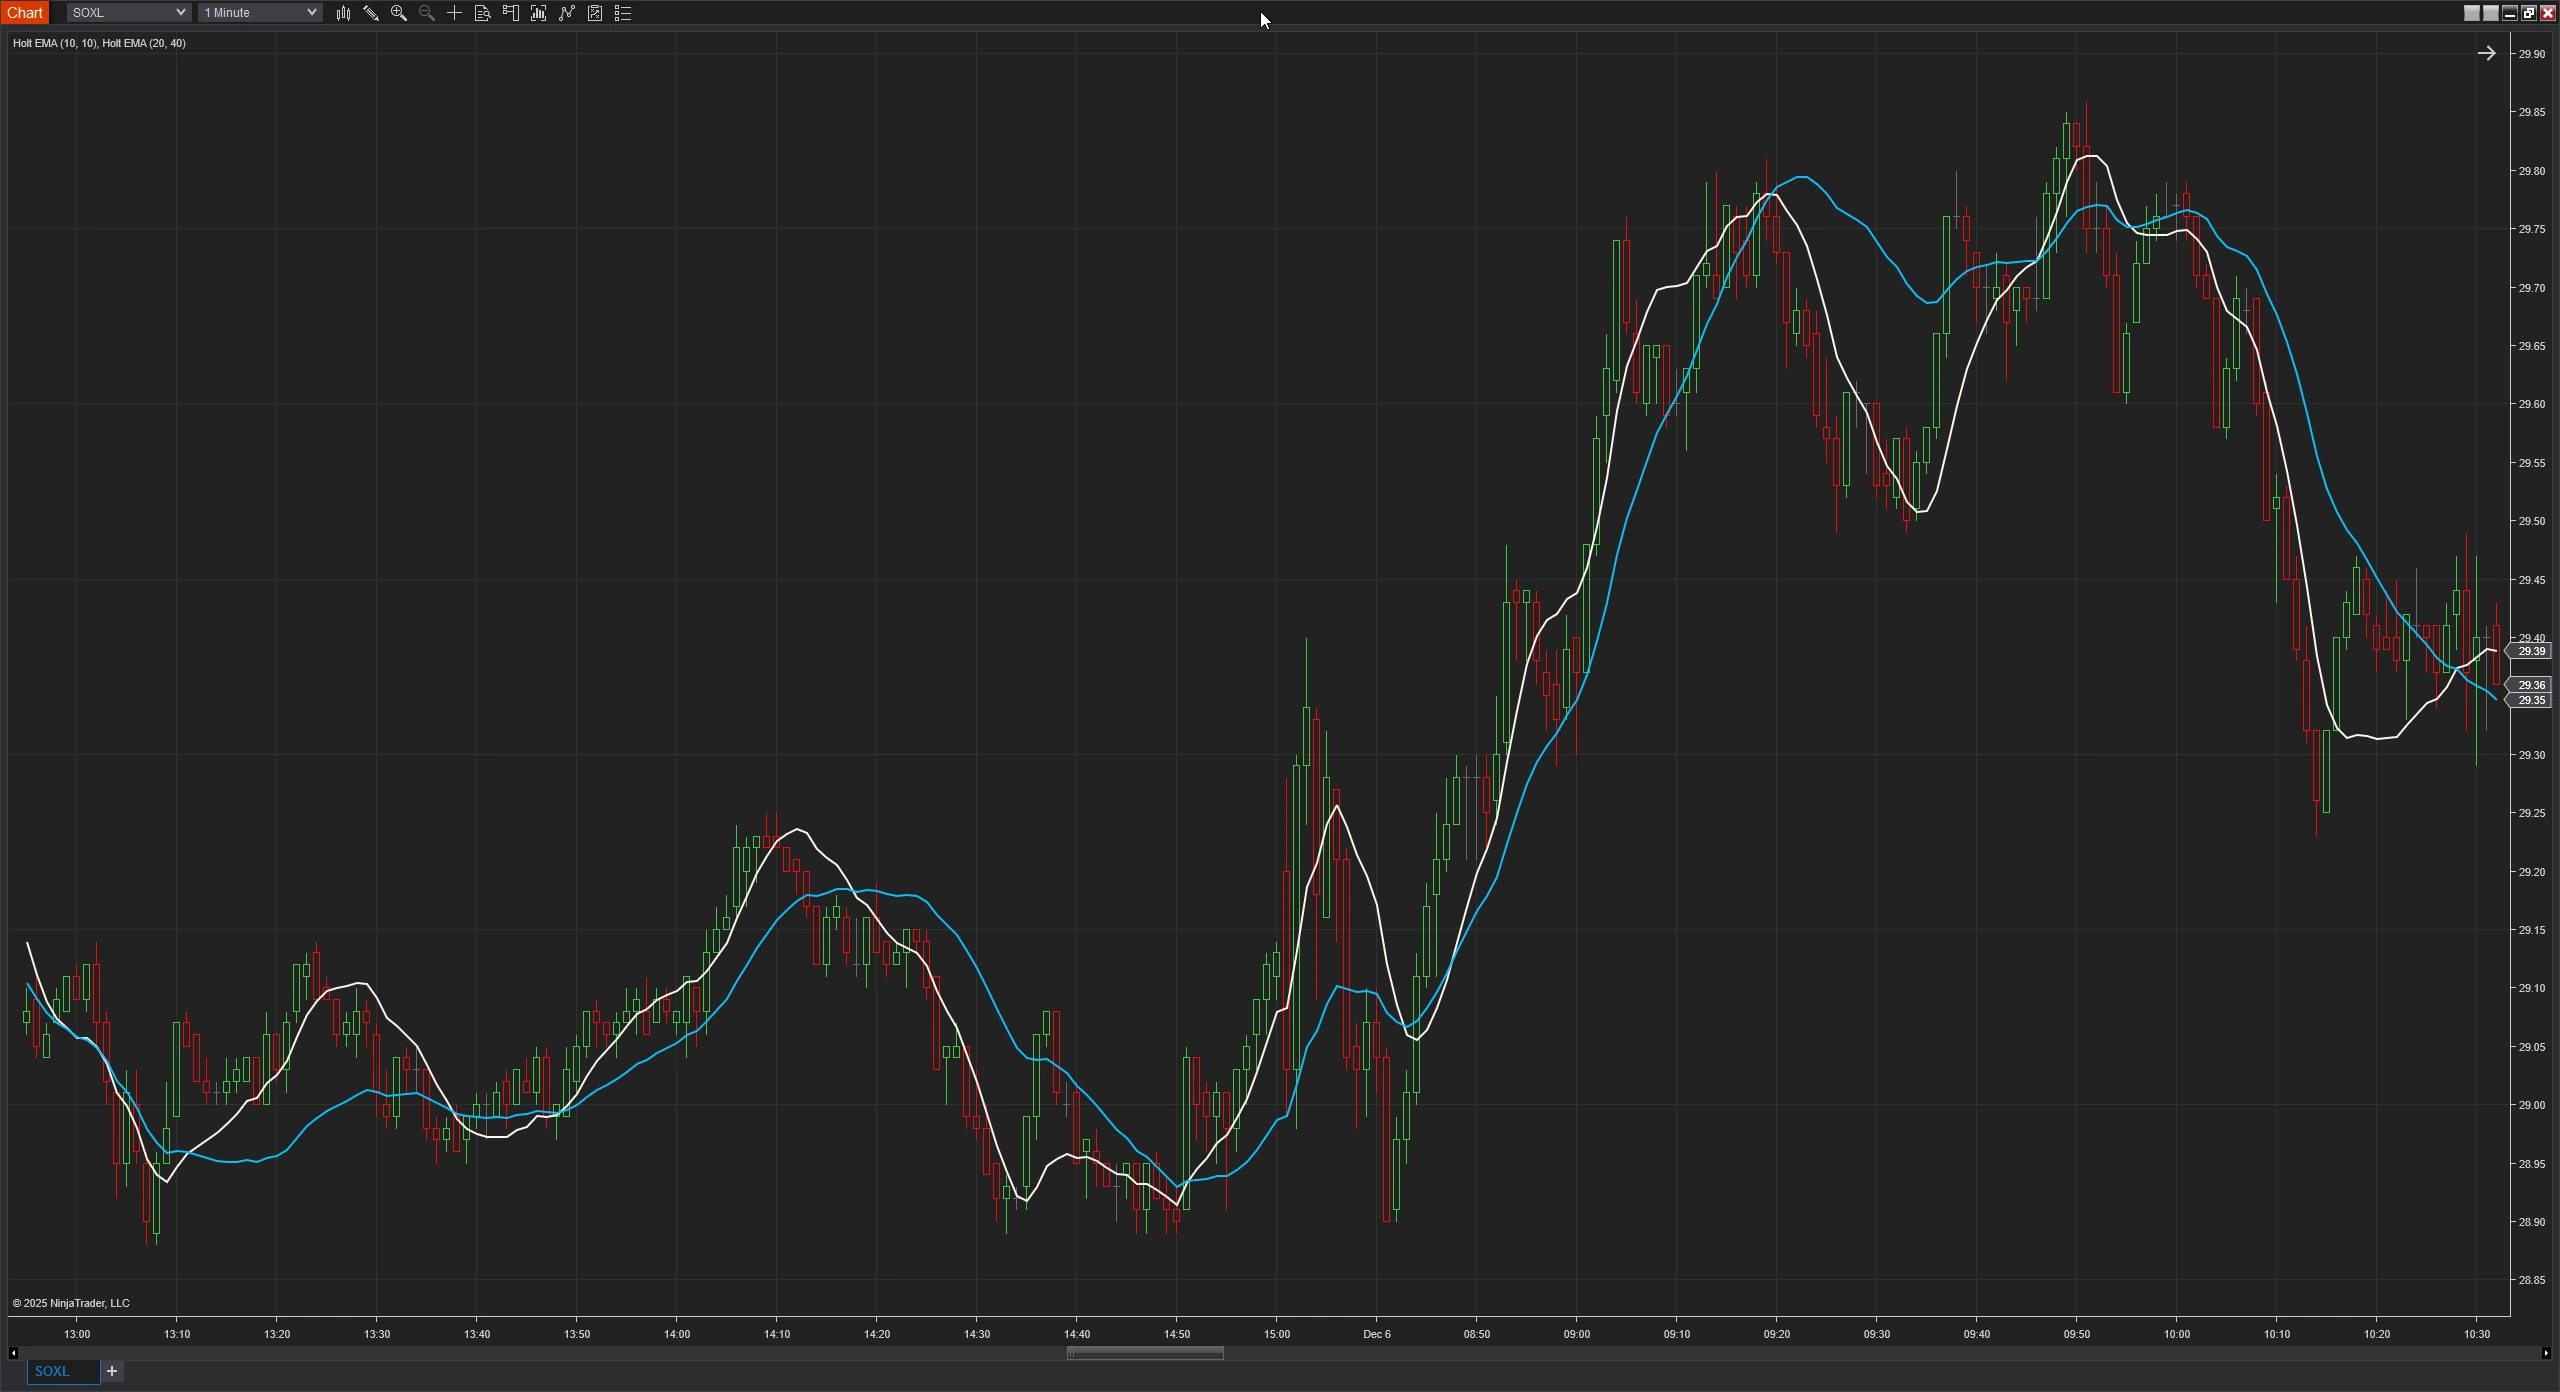
Review the screenshots for setup options.
Click here for a list of all of NinjaTrader's Downloads.
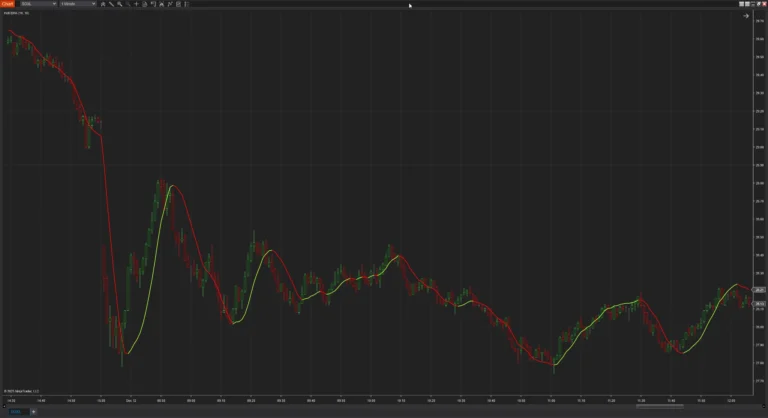
Screenshots
Media