sharp vision traders
Enhancing Your Trading Experience

Dynamic Slow RSI (NT)
- Categories: Indicator, NinjaTrader
- Tags: Momentum, Oscillator, RSI
- Type: Free
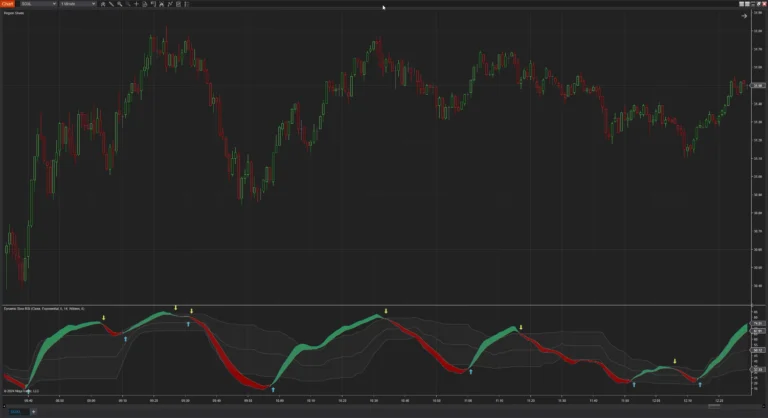
The Dynamic Slow RSI for NinjaTrader is an advanced version of the RSI. It modifies the RSI calculation by comparing current price to its moving average
Note: This download requires NinjaTrader 8 release 8.1.3 or newer.
Introduction to the Dynamic Slow RSI Indicator
The Dynamic Slow RSI Indicator for NinjaTrader is an advanced version of the standard RSI oscillator. It modifies the traditional RSI calculation by:
- Comparing the current price to an exponential moving average (EMA) instead of the previous close price.
- Incorporating customizable averaging methods for more flexibility.
- Offering dynamic overbought and oversold limits that adjust based on market volatility.
- Including a signal curve for crossover analysis.
- Utilizing a polynomial smoothing function to further refine the indicator's responsiveness.
How Does the Dynamic Slow RSI Work?
The indicator operates through several key steps:
- Data Input Selection: Traders can choose from various price inputs such as Close, High-Low average, VWAP, etc.
- Calculating the EMA of the Price: The indicator computes the EMA (or another chosen average) of the selected price input over a specified Source Period.
- Determining Price Differences:
- EMA Difference: The difference between the current price and its EMA.
- Absolute EMA Difference: The absolute value of the EMA difference.
- Averaging the Changes:
- Net Change Average: The average of the EMA differences over the RSI Period using a chosen RSI Averaging Method.
- Total Change Average: The average of the absolute EMA differences over the same period.
- Calculating the Slow RSI Value:
- Change Ratio: The ratio of the Net Change Average to the Total Change Average.
- Slow RSI: Scaled to oscillate between 0 and 100 using the formula:
Slow RSI = 50 * (Change Ratio + 1).
- Applying Polynomial Smoothing (Optional):
- If enabled, the Slow RSI values are further smoothed using a polynomial function, which provides a more responsive and less noisy signal compared to traditional smoothing methods.
- Signal Line Calculation:
- An optional Signal Line is calculated by applying another averaging method to the Slow RSI values over a specified Signal Period.
- Dynamic Limits (Optional):
- Upper and Lower Limits: Instead of fixed thresholds, the indicator can calculate dynamic overbought and oversold levels based on the highest and lowest Slow RSI values over a specified Max-Min Limit Lookback period.
Key Features of the Dynamic Slow RSI Indicator
1. Customizable Averaging Methods
- Source Average Method: Choose from various averaging techniques for the main EMA curve:
- Simple Moving Average (SMA)
- Exponential Moving Average (EMA)
- Weighted Moving Average (WMA)
- Hull Moving Average (HMA)
- Wilder's Moving Average
- Triangular Moving Average (TMA)
- Volume Weighted Moving Average (VWMA)
- Triple Exponential Moving Average (TEMA)
- RSI Average Method: Select the averaging method for the RSI calculation, offering the same options as above.
- Signal Average Method: Customize the averaging method for the Signal Line.
2. Polynomial Smoothing Function
- Advanced Smoothing: The indicator offers an optional polynomial smoothing function that applies a weighted average to the Slow RSI values.
- Customization: Traders can enable or disable this feature based on their preference for signal sensitivity.
3. Dynamic Limits
- Adaptive Overbought/Oversold Levels: The indicator can calculate dynamic thresholds based on recent Slow RSI values, adjusting to market volatility.
- Max-Min Limit Lookback: Set the period over which the highest and lowest Slow RSI values are considered for dynamic limit calculation.
- Advantages:
- Market Adaptability: Ensures the overbought and oversold levels remain relevant under different market conditions.
- Improved Signal Accuracy: Helps prevent false signals during periods of high or low volatility.
4. Signal Curve
- Additional Signal Line: A smoothed version of the Slow RSI that aids in identifying trend changes through crossovers.
- Customizable Parameters:
- Signal Period: The number of periods used to calculate the Signal Line.
- Signal Average Method: Choose the averaging technique for the Signal Line.
5. Visual Enhancements
- Shading Zones:
- Overbought/Oversold Zones: Apply shading between the upper and lower limits to highlight critical areas.
- Signal Shading: Optional shading between the Slow RSI and Signal Line to emphasize bullish or bearish conditions.
- Customizable Colors and Opacity: Adjust the appearance of lines and shading to suit personal preferences.
6. Buy and Sell Signals
- Automatic Signal Generation: The indicator can display arrows or markers when certain conditions are met, such as crossovers or threshold breaches.
- Customizable Display Options:
- Show on Price Panel: Choose whether to display signals on the main price chart or the indicator panel.
- Custom Signal Brushes: Select colors and styles for buy and sell signals.
Review the screenshots and video for setup options.
Click here for a list of all of NinjaTrader's Downloads.

Screenshots
Media
