
sharp vision traders
Enhancing Your Trading Experience

Dynamic Jurik RSX (TS)
- Categories: Indicator, ThinkOrSwim
- Tags: Jurik, RSI
- Type: Priced
The Dynamic Jurik RSX for ThinkOrSwim is a refined version of the well-known RSI indicator. It provides a smoother representation of market momentum, reducing the number of false signals and helping traders make better-informed decisions.
Introduction to Dynamic Jurik RSX
Introduced by Mark Jurik, the Dynamic Jurik RSX for ThinkOrSwim is a refined version of the well-known RSI indicator. While the RSI is a popular momentum oscillator used to identify overbought and oversold conditions, it can sometimes be prone to producing false signals due to its sensitivity to market noise. The Dynamic Jurik RSX addresses this issue by providing a smoother of market momentum, reducing the number of false signals and helping traders make better-informed decisions.
This version is an enhanced version compared to all the ones available online. It is packed with useful customization. The overbought and oversold limits can be dynamic by adjusting the lookback period. This is very helpful if set appropriately based on the time frame.
Key Features of the Dynamic Jurik RSX
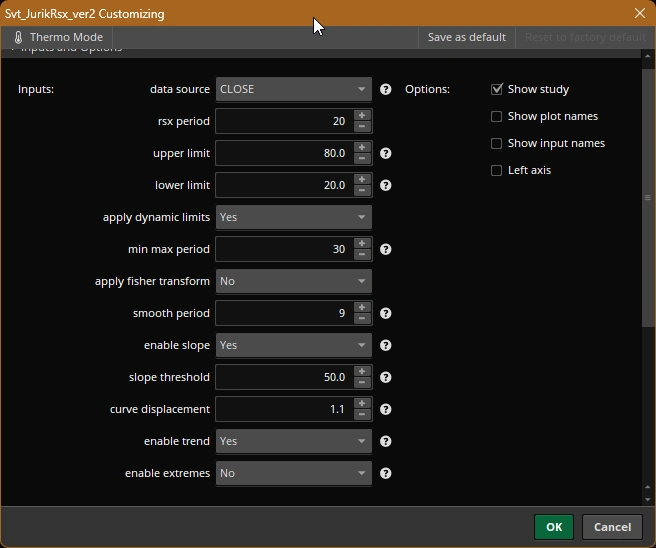
The algorithm used to calculate the Jurik moving average is based on a reveal posted here. Customization options have been added to allow the user a bit more flexibility:
1. Input Data Source
- Purpose: Allows you to select the type of price data that the RSX will analyze, such as the closing price, high, low, or a combination.
- Benefit: Customizing the input data source lets you tailor the RSX to reflect the specific price movements you want to focus on, whether it’s the average price, highs, lows, or another metric.
2. Period
- Purpose: Sets the lookback period for calculating the RSX, which determines how many bars of data are considered.
- Benefit: Adjusting the period affects the sensitivity of the RSX. A shorter period will make the RSX more responsive to recent price changes, while a longer period will smooth out the indicator to capture broader trends.
3. Dynamic Limits (Upper and Lower Limits)
- Purpose: Enables the RSX limits to adapt dynamically to market conditions by setting upper and lower limits for identifying overbought and oversold regions.
- Benefit: Dynamic limits make the RSX more adaptable, allowing it to adjust to changing market conditions and helping you identify more accurate overbought or oversold signals.
4. Fisher Transform
- Purpose: An optional feature that applies the Fisher Transform to the RSX, which can make the indicator more sensitive to price movements and help in spotting reversals.
- Benefit: This option provides a more nuanced view of market momentum, making it easier to identify turning points and trend reversals with greater precision.
5. Smoothing Period
- Purpose: Determines the degree of smoothing applied to the RSX, particularly when using the Fisher Transform.
- Benefit: Smoothing helps reduce market noise, allowing the RSX to produce clearer signals that are easier to interpret, especially in volatile markets.
Visual Customizations
1. Trend Display
- Purpose: Enables color-coding of the RSX line based on the direction of the trend (bullish or bearish).
- Benefit: Visual cues such as color changes make it easier to spot trend directions at a glance, enhancing your ability to quickly react to market conditions.
2. Extreme Coloring
- Purpose: Highlights areas where the RSX enters overbought or oversold regions by using distinct colors.
- Benefit: This visual aid helps traders quickly identify potential reversal points, improving the timing of entry and exit decisions.
3. Slope Display
- Purpose: Optionally highlights the slope of the RSX line, helping to visualize the strength and direction of momentum.
- Benefit: Slope indicators provide an additional layer of analysis, indicating the acceleration or deceleration of a trend, which can be crucial for making timely trading decisions.
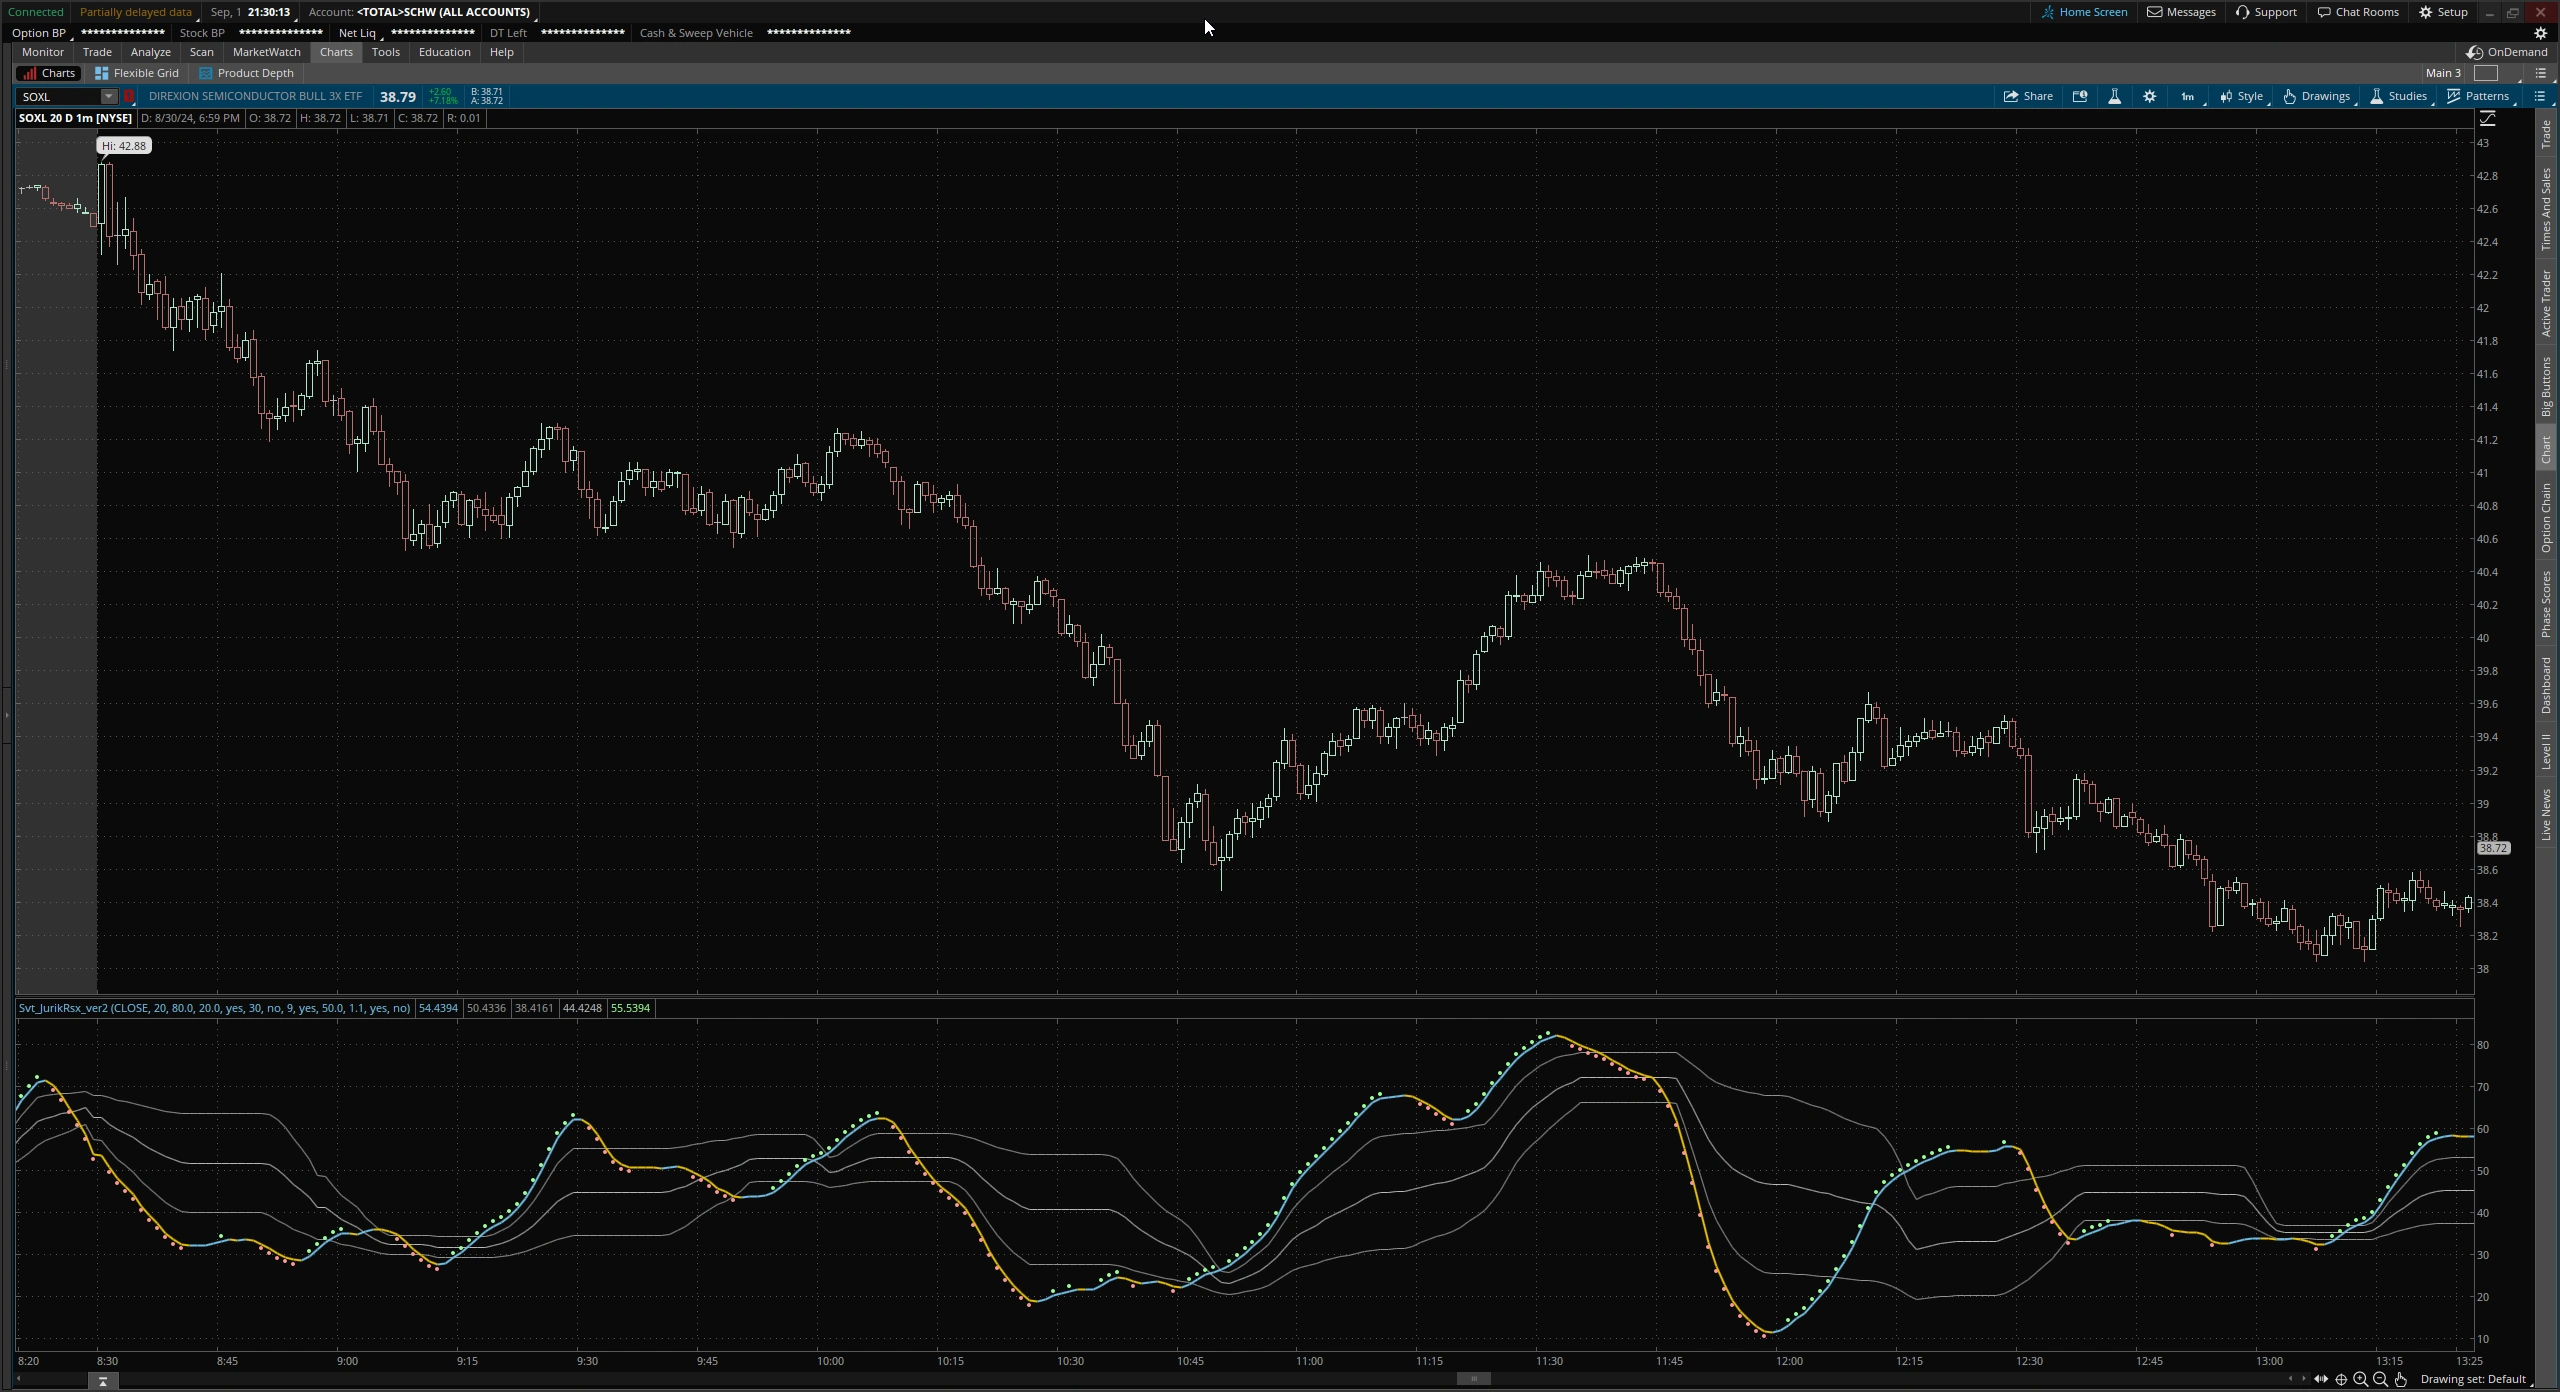
Practical Applications of Jurik RSX in Trading
The Jurik RSX is not just about understanding current market conditions; it's about making informed trading decisions with a highly customizable tool. Here’s how traders can utilize its features:
- Trend Identification: Use the trend display to easily see whether the market is trending up or down.
- Overbought/Oversold Conditions: Apply the dynamic limits and extreme coloring features to identify when the market is potentially overbought or oversold, signaling possible reversals.
- Momentum Analysis: Utilize the slope display to assess the strength of current trends, which can help in deciding whether to hold onto a position or exit.
- Smoothing and Fisher Transform: These features help filter out market noise, allowing you to focus on the most significant price movements and avoid getting caught up in short-term fluctuations.
Conclusion
The Jurik RSX is a versatile and sophisticated indicator that can be customized to suit a wide range of trading strategies. Whether you're a short-term trader looking to capture quick gains or a long-term investor seeking to identify major market trends, the Dynamic Jurik RSX offers the tools you need to improve your trading outcomes. By adjusting its various parameters and leveraging its visual cues, you can gain a clearer understanding of market dynamics and make more informed decisions.
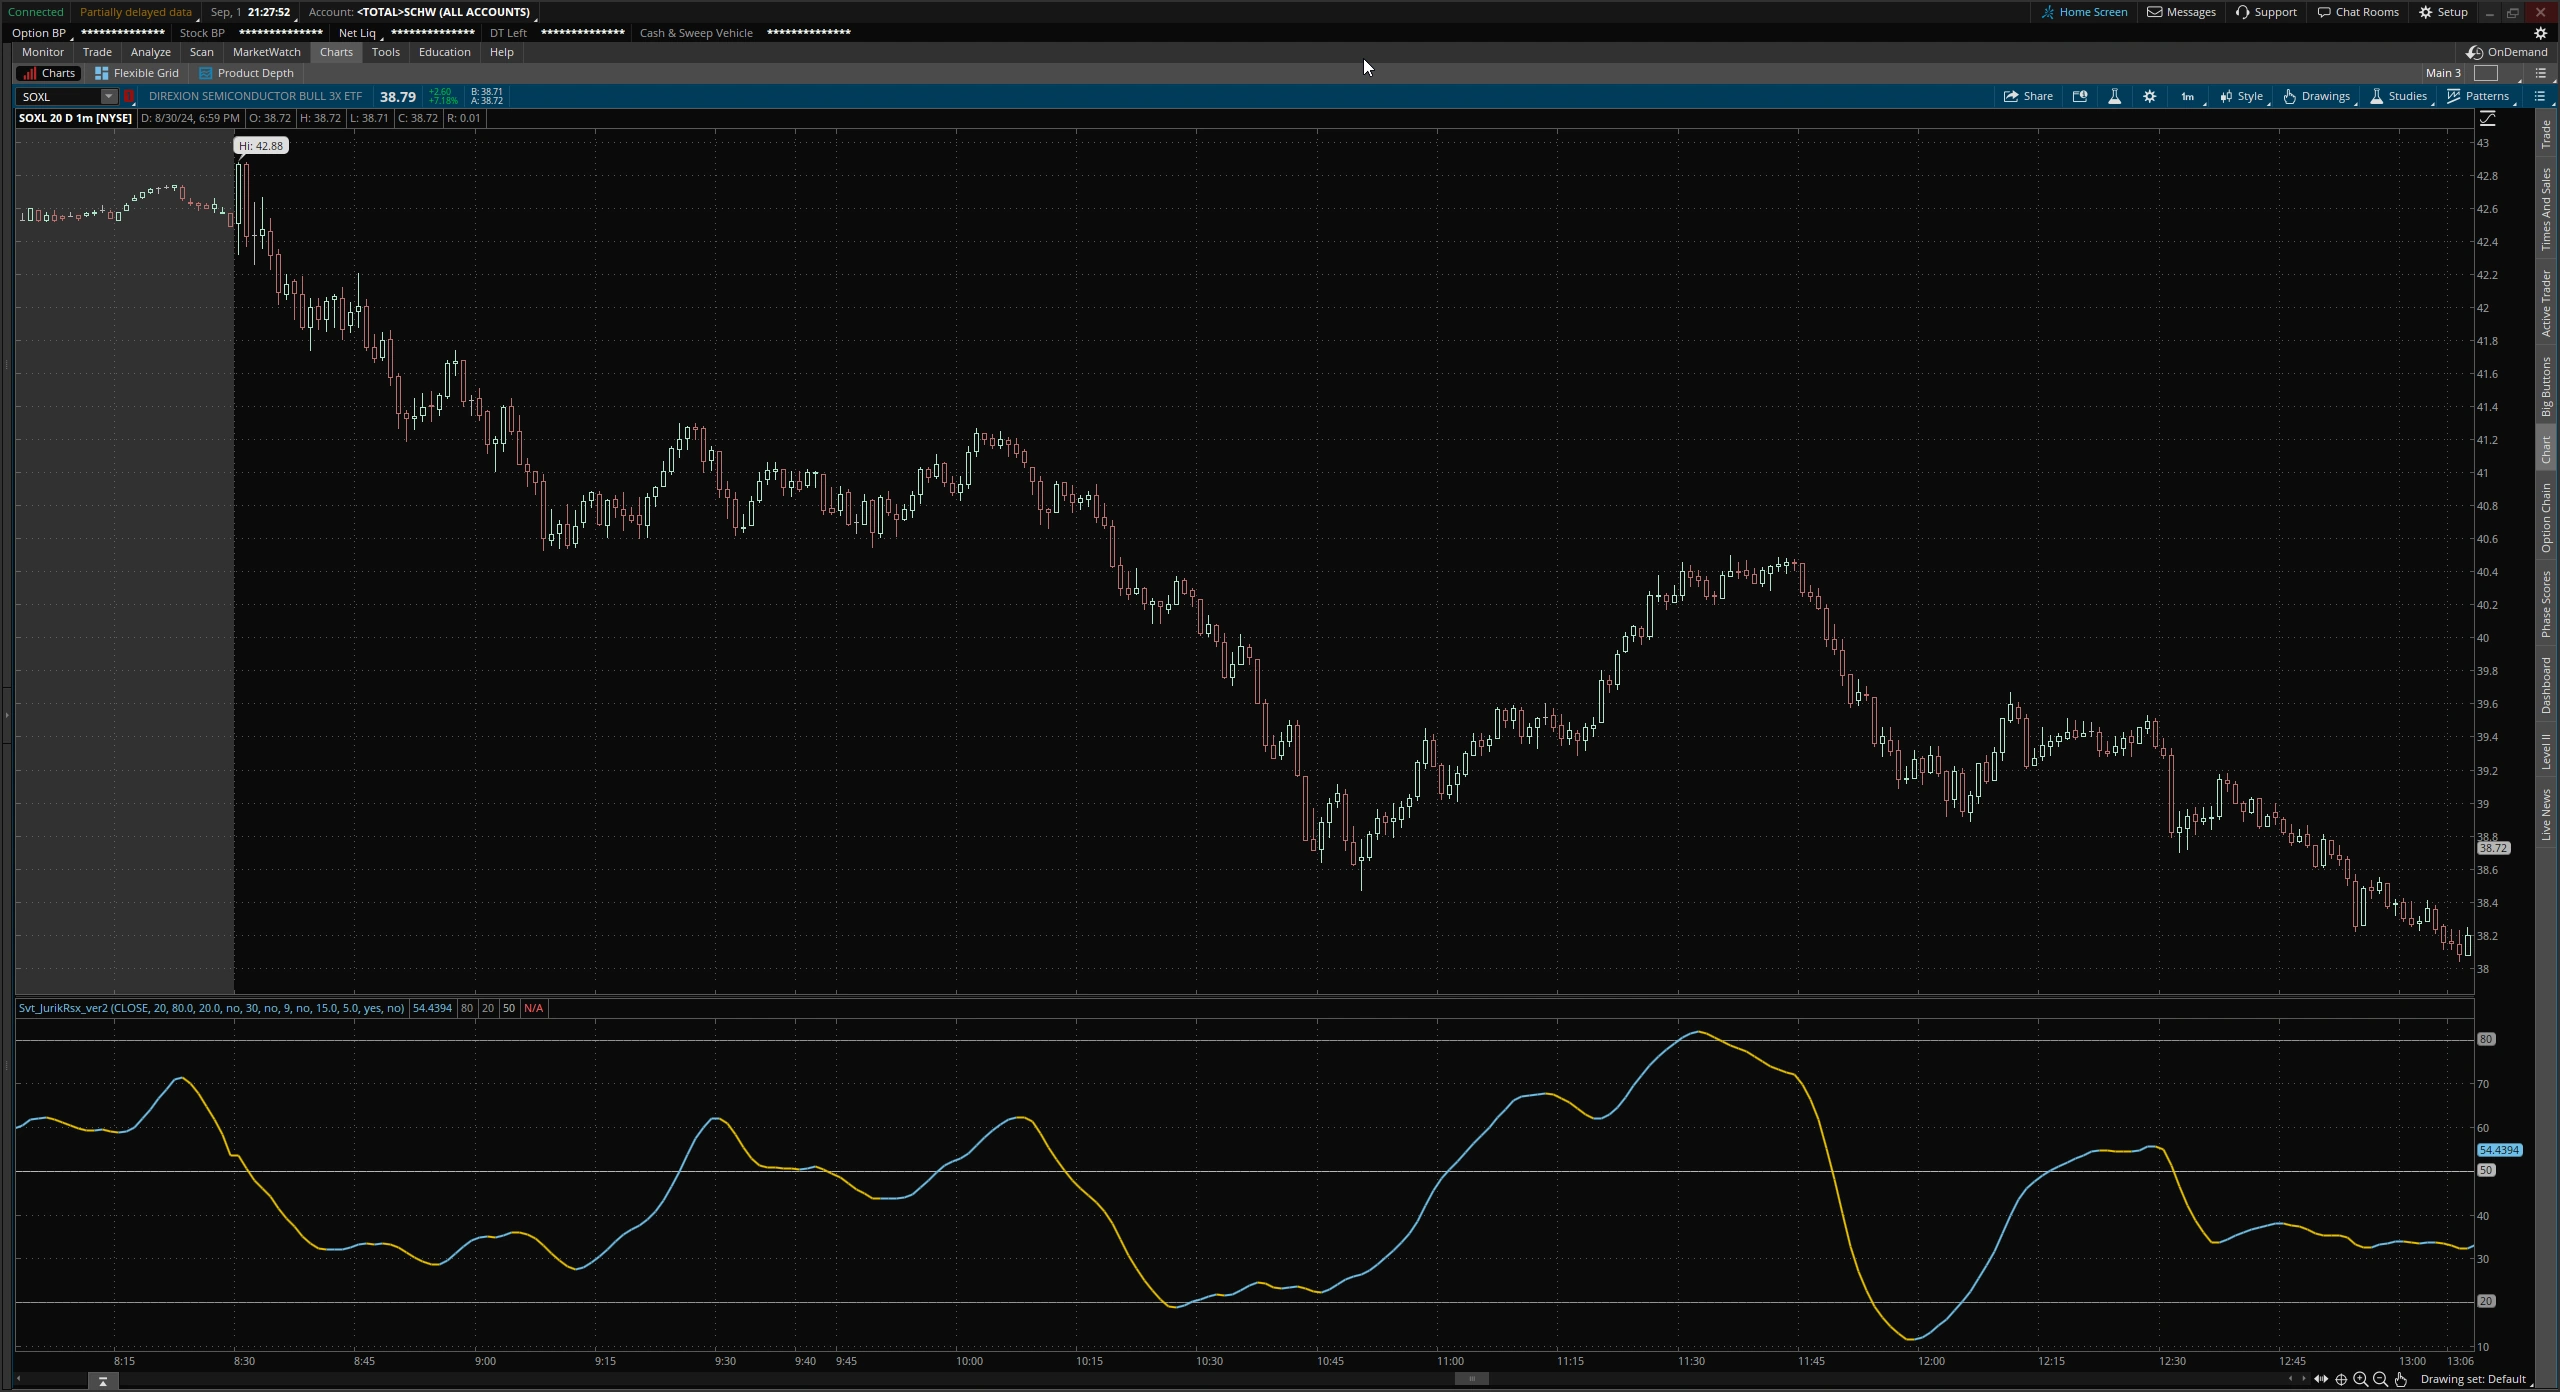
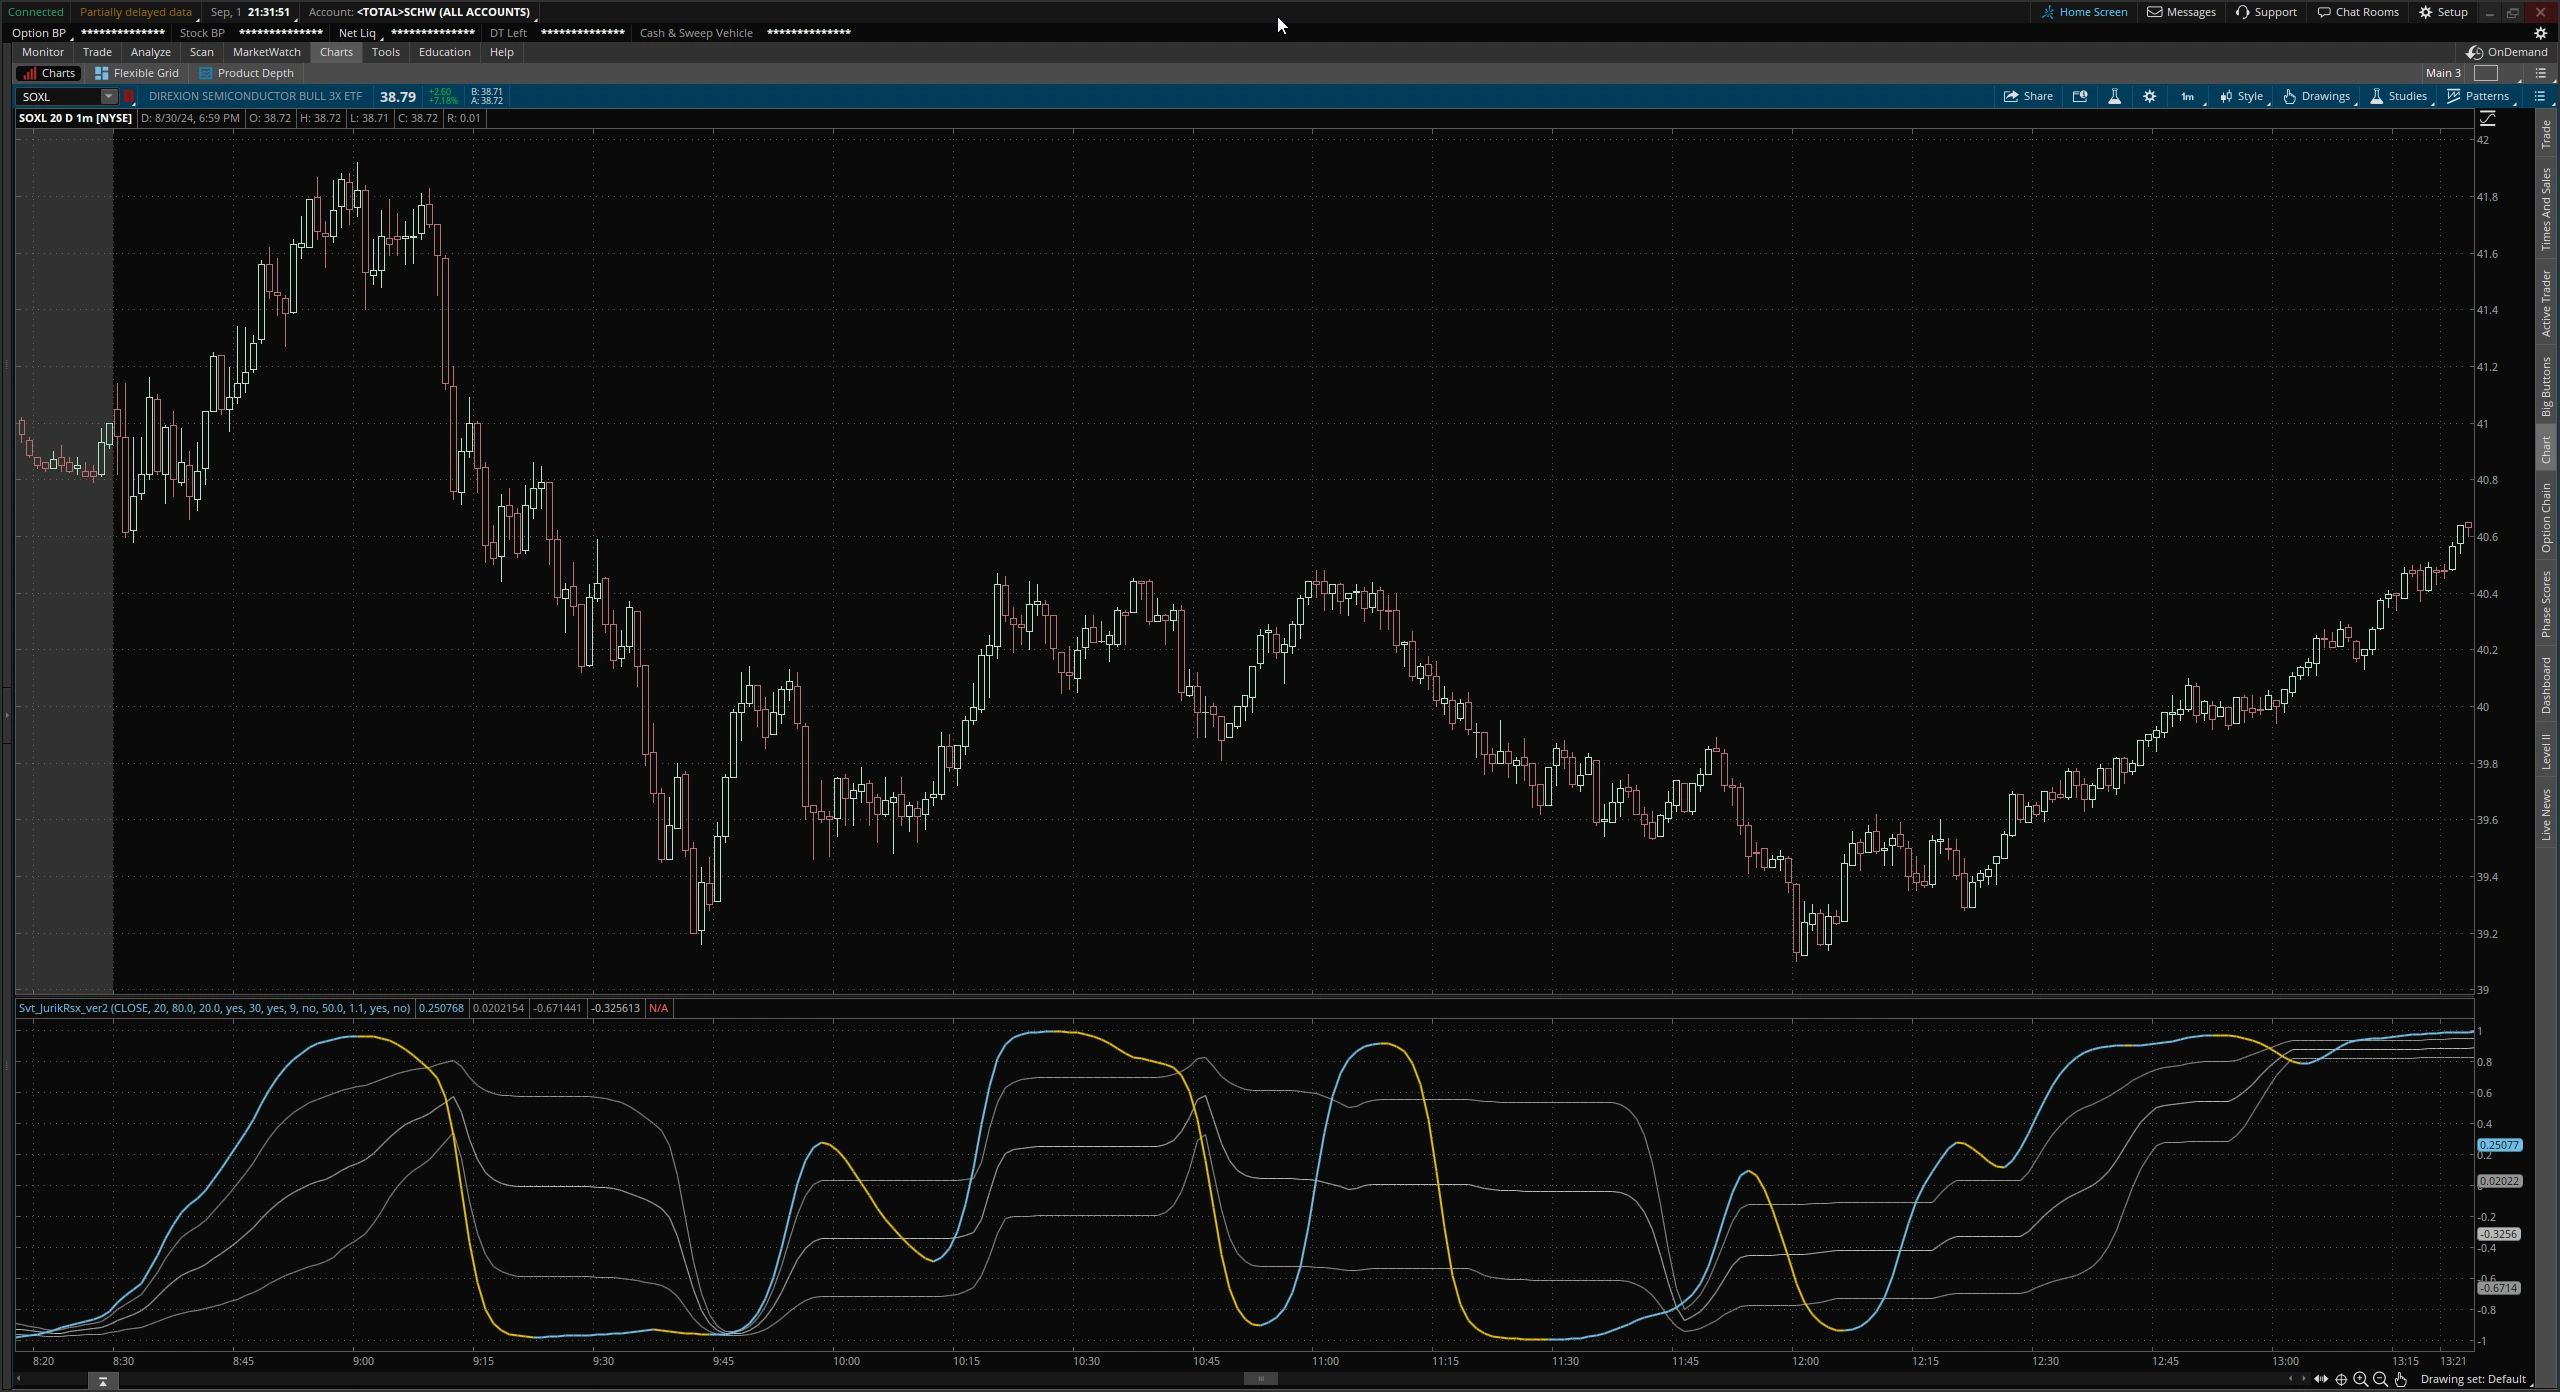
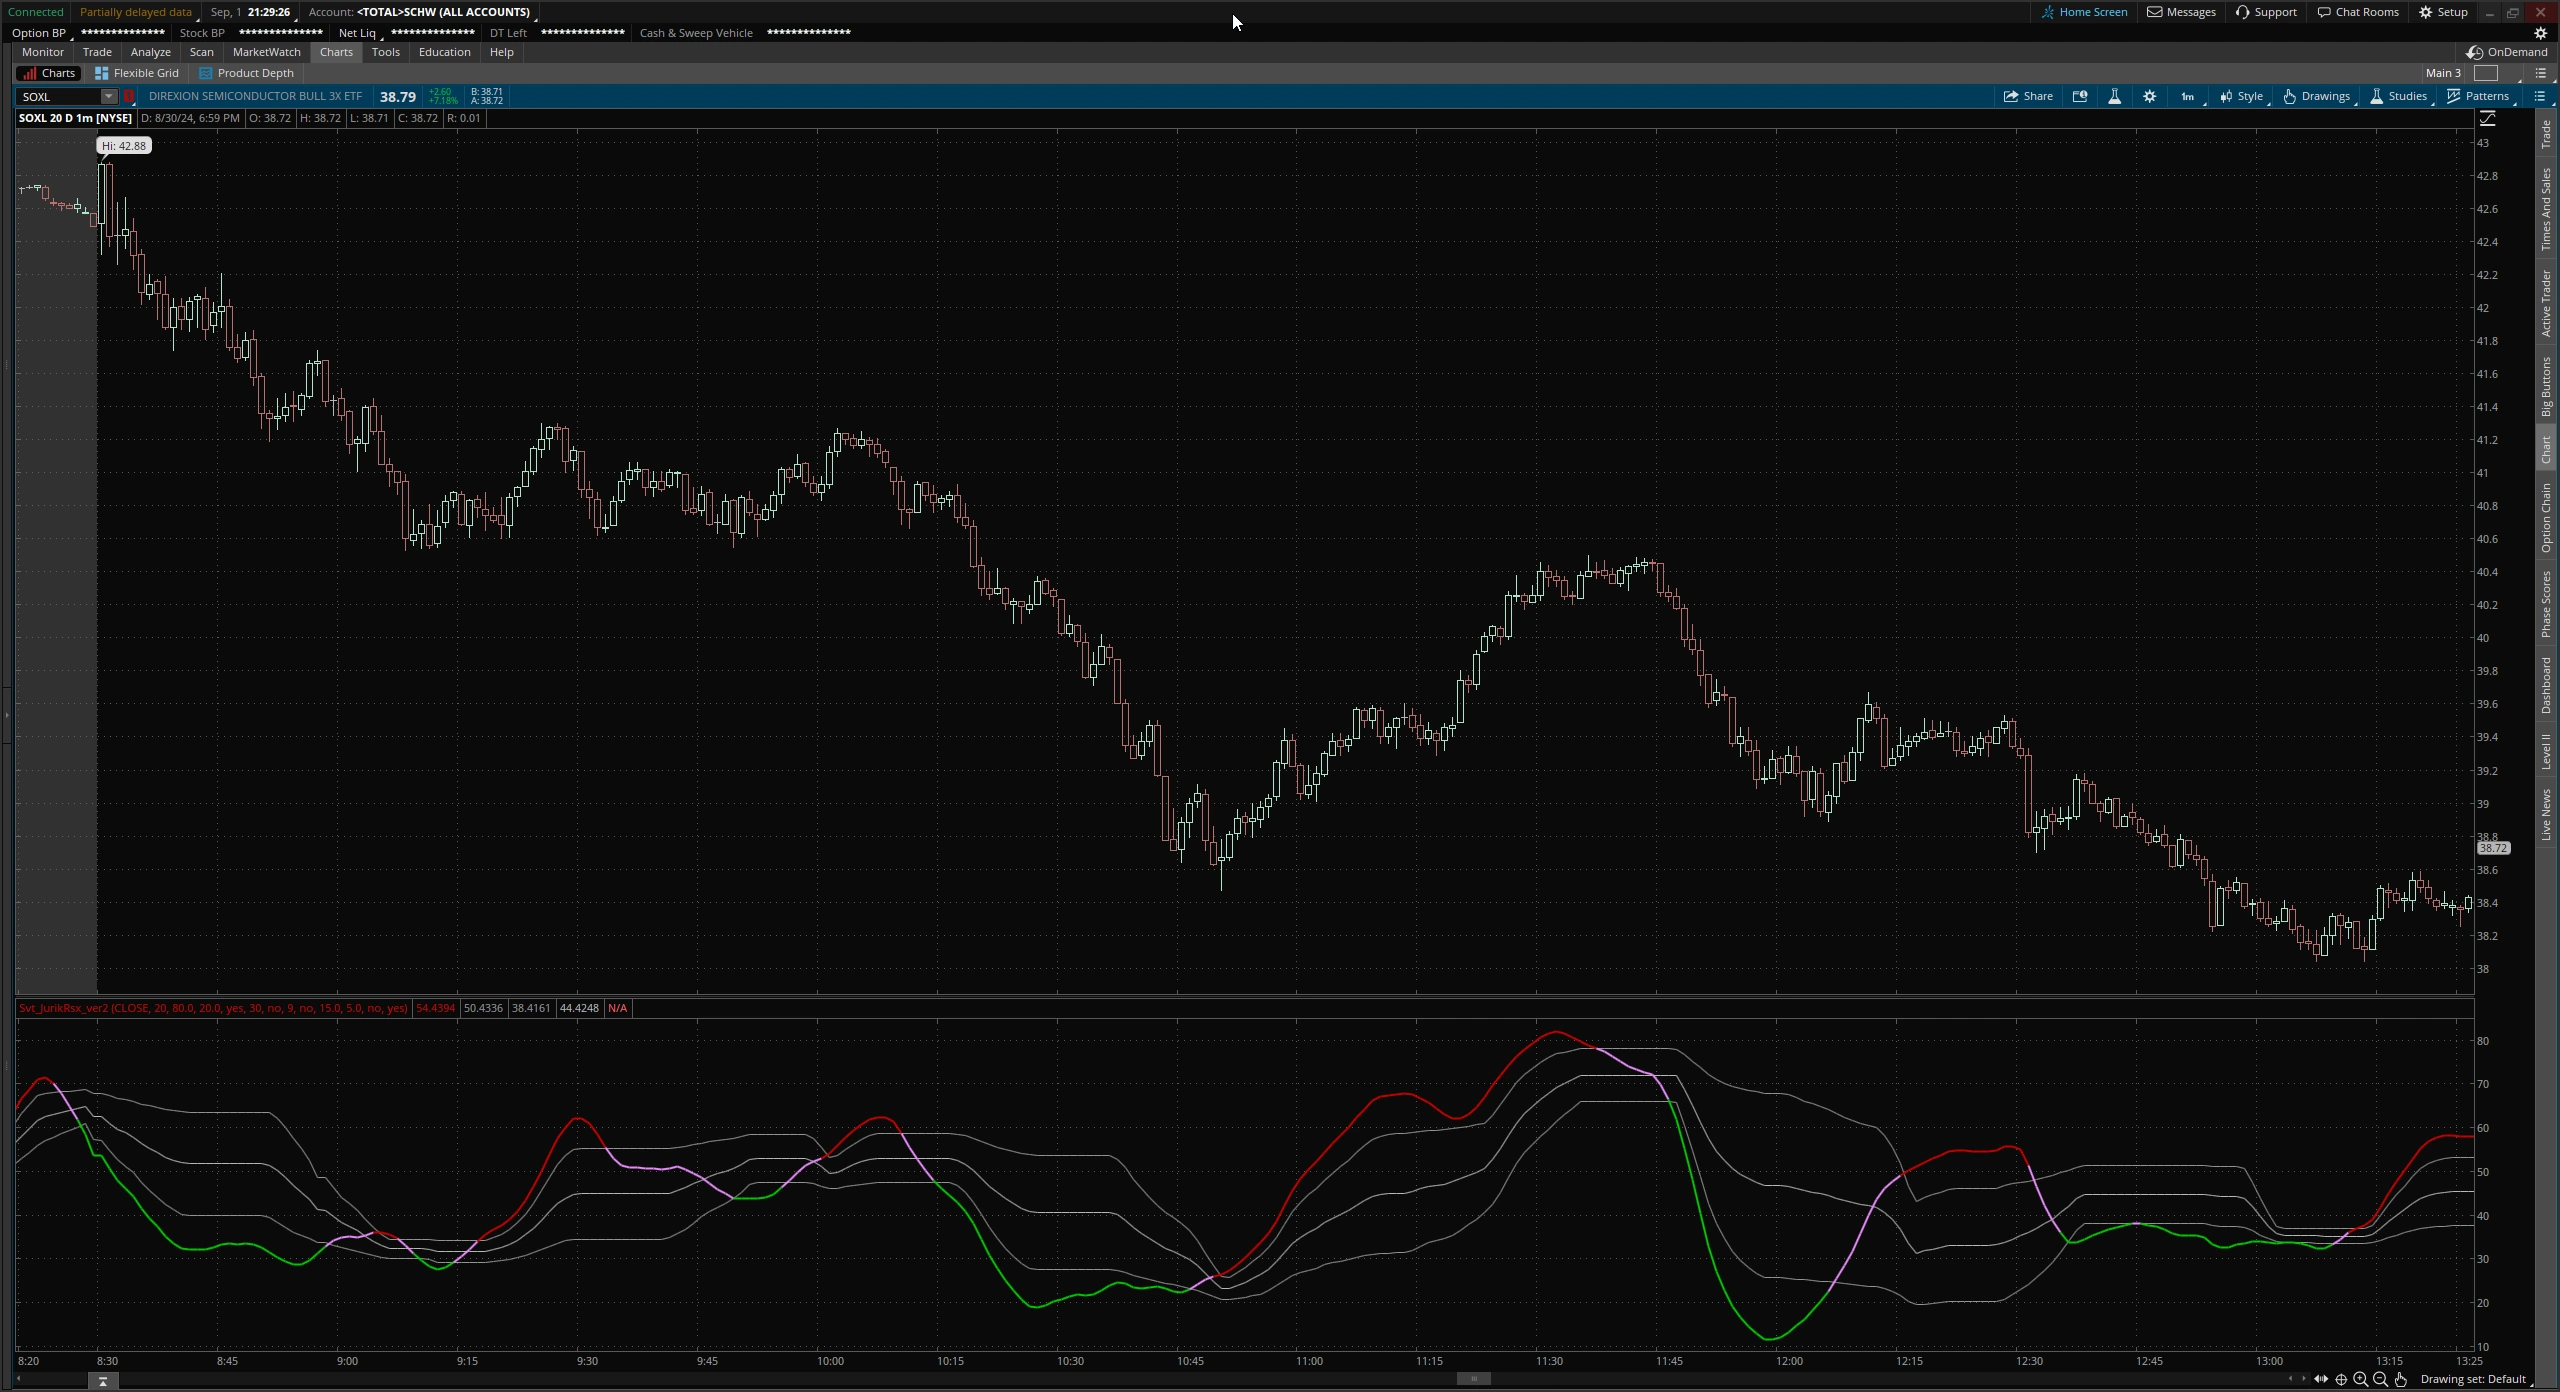
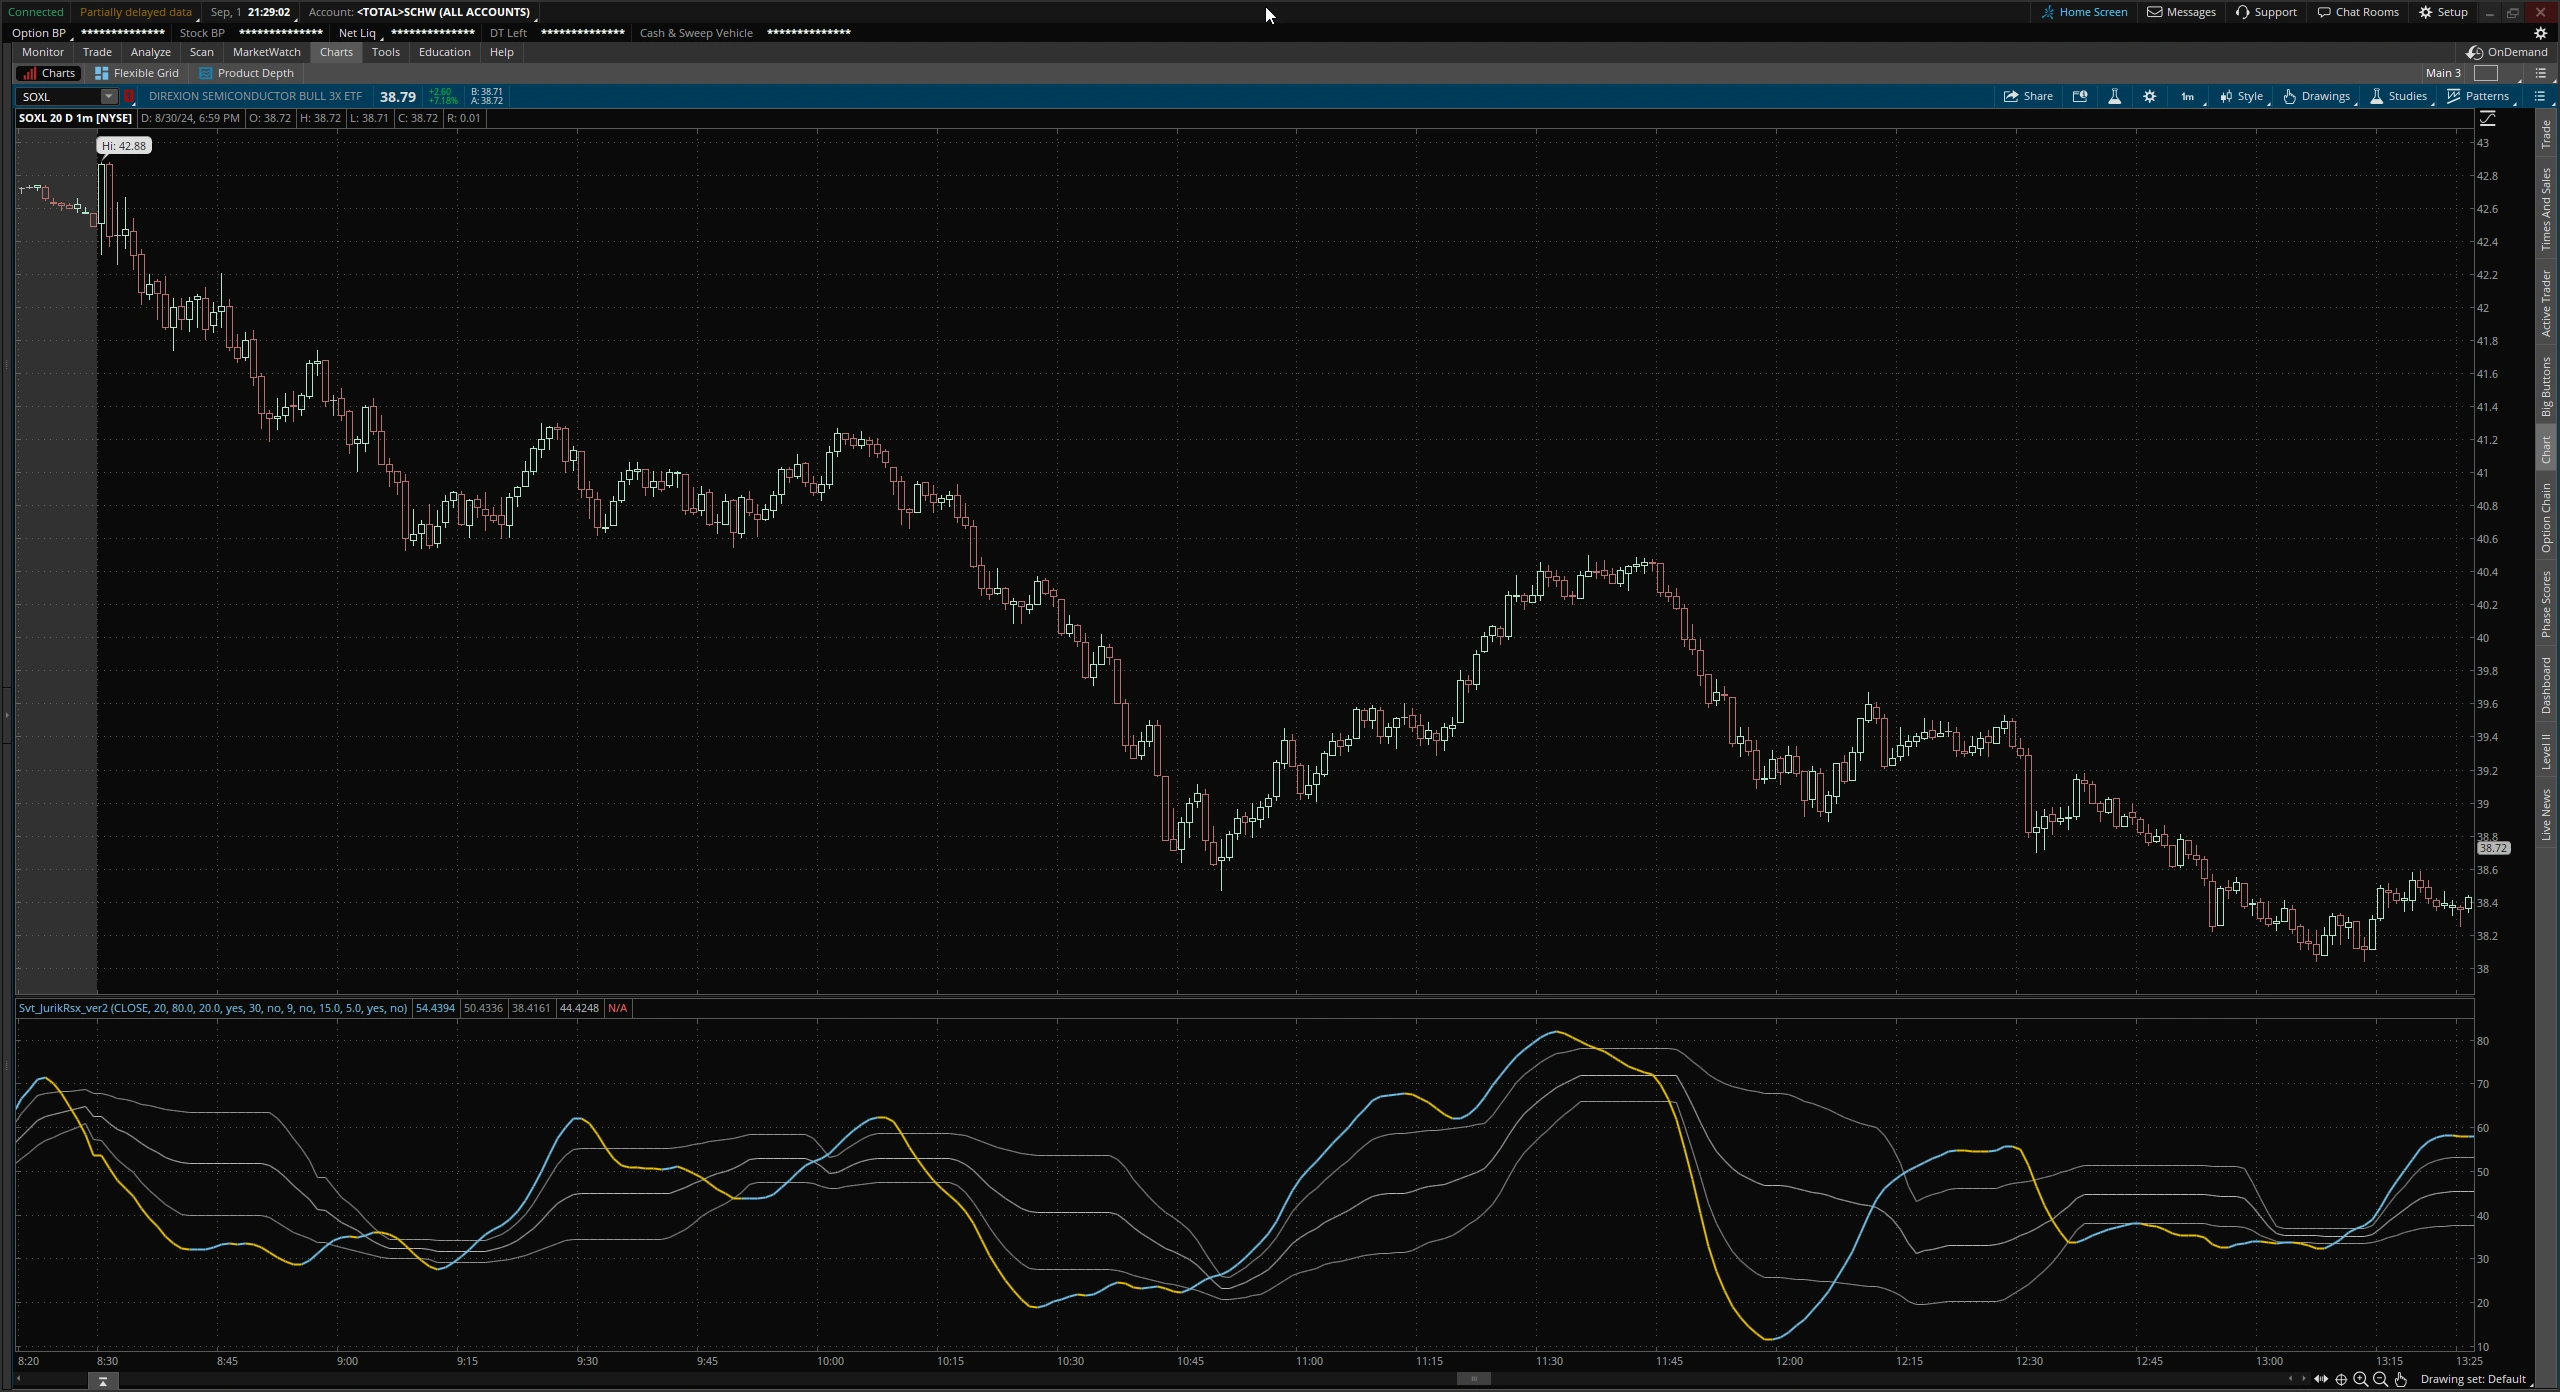
Review the screenshots for setup options.
Check out a list of all of ThinkOrSwim Downloads.
Click here for installation instructions.

Screenshots
Media