

Introduction to Adaptive Sharp Momentum Study
The Adaptive Sharp Momentum Study, available on TradingView, has the following all-in-one features:
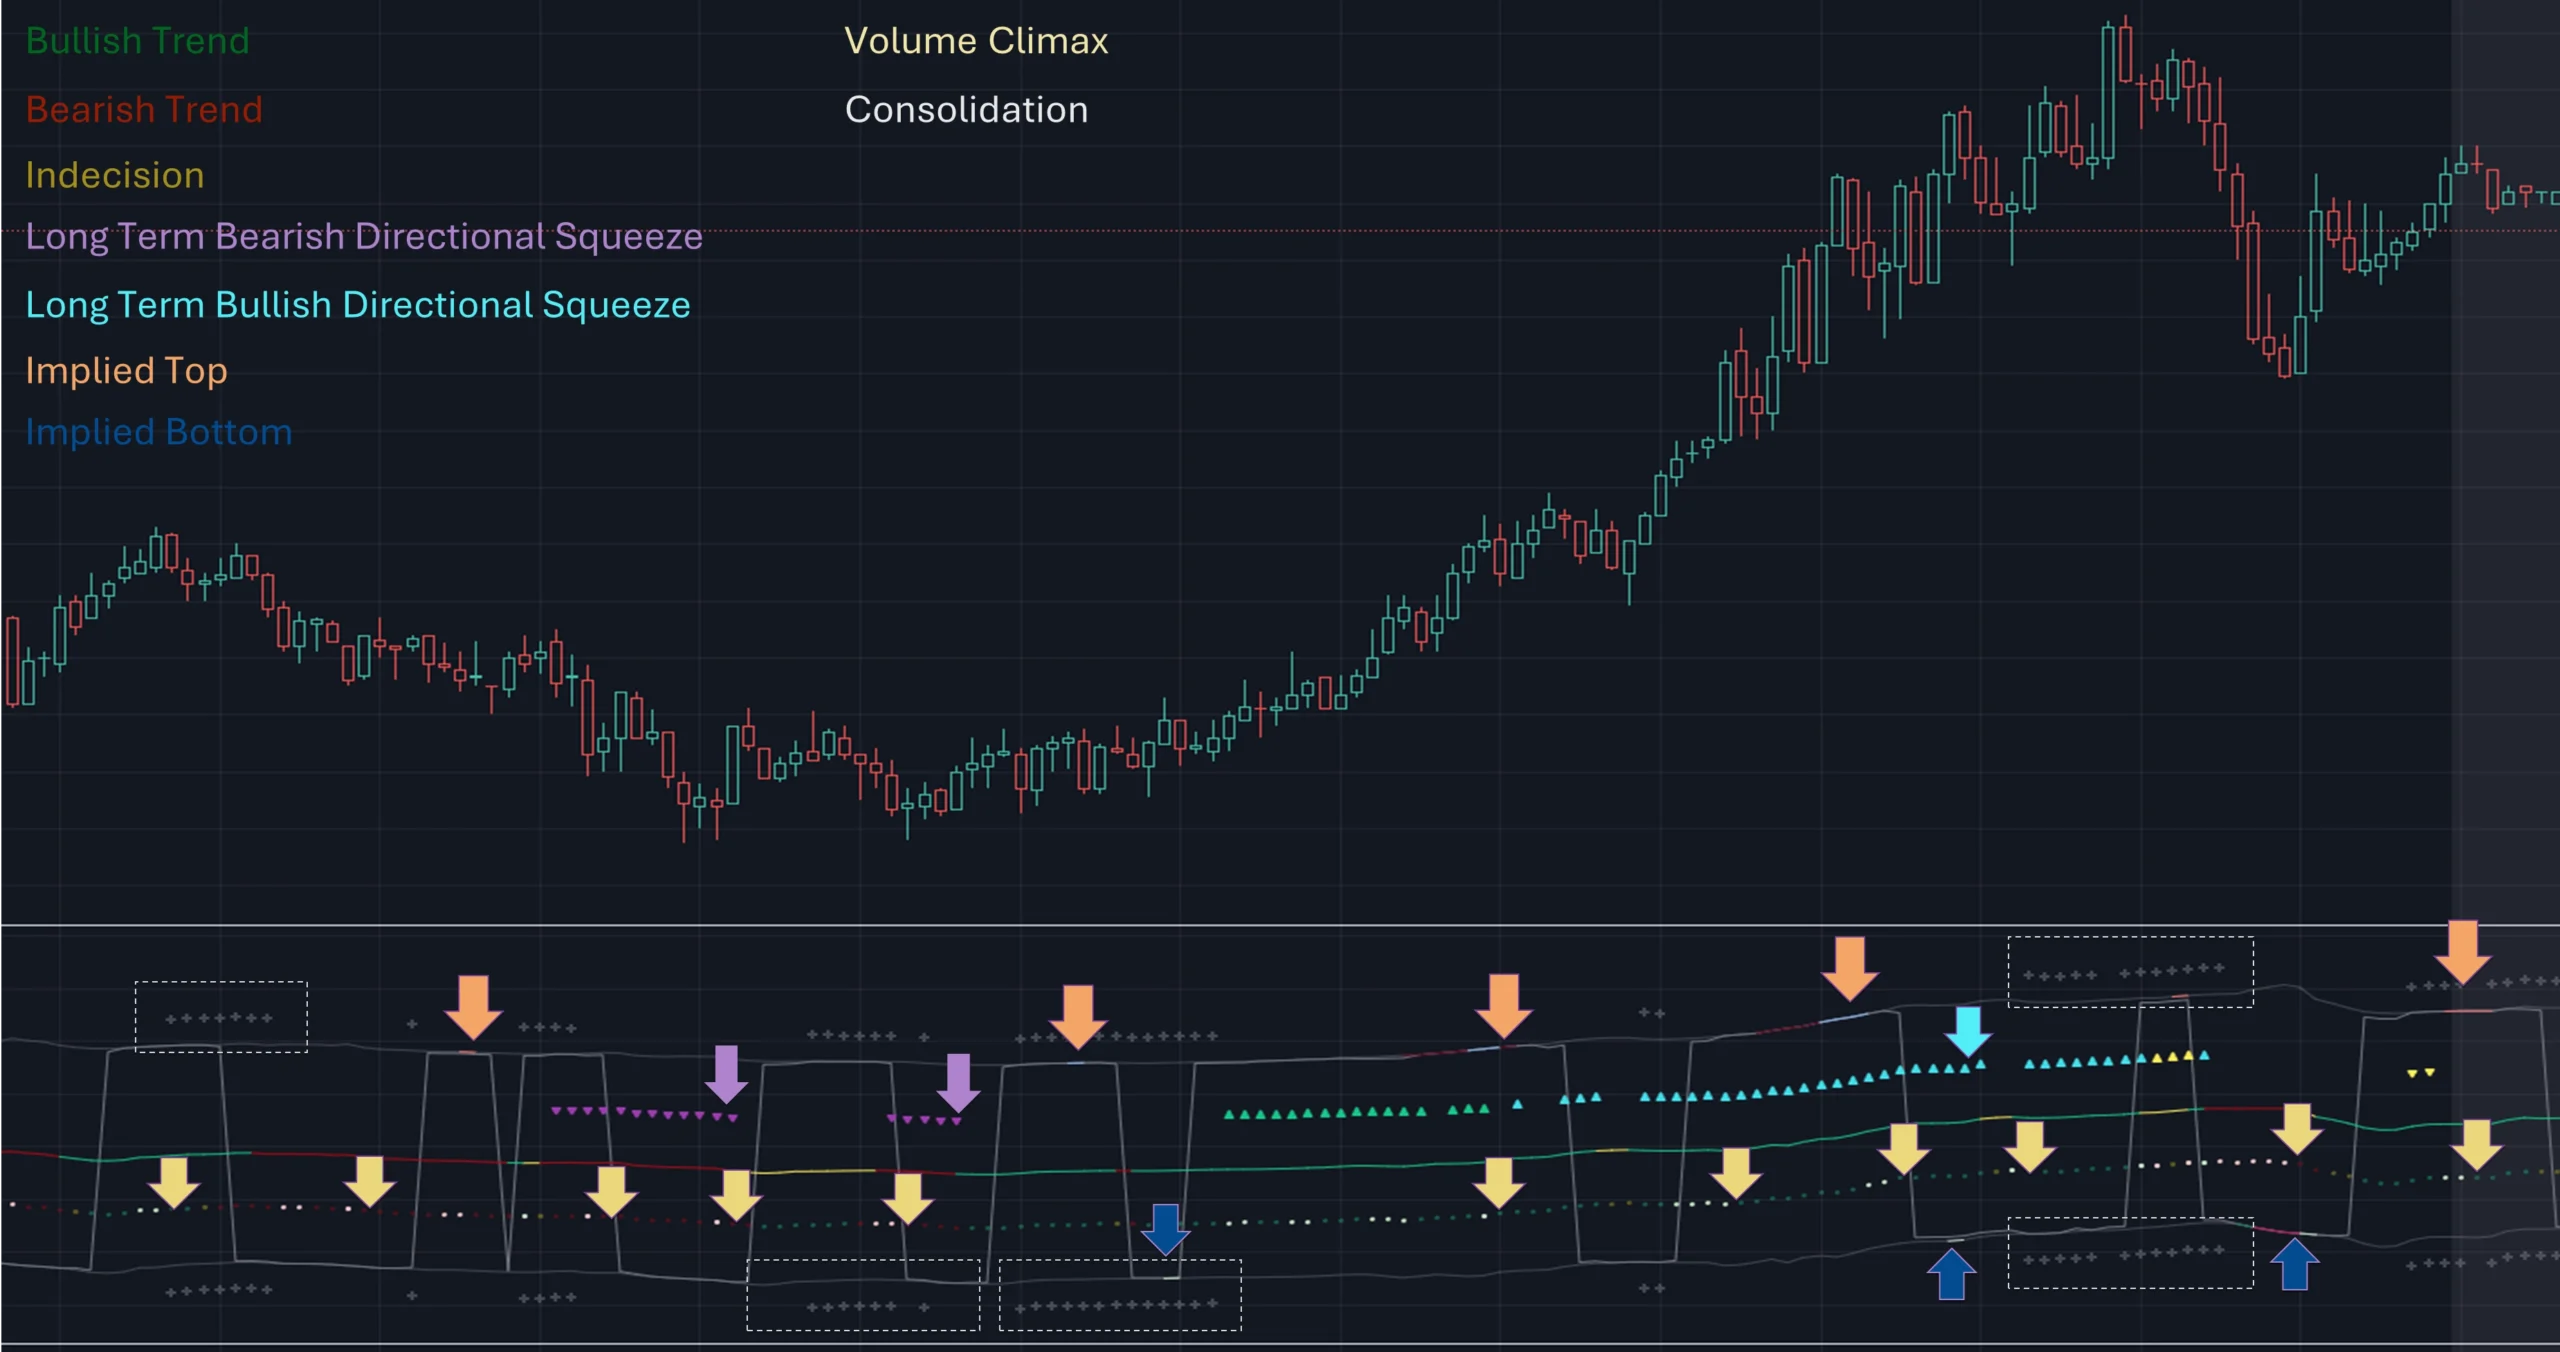
- A noise-free, trend-following indicator.
- Automatically detects implied tops and bottoms within fast price cycles.
- It identifies price consolidations and periods of indecision; often challenging to spot.
- Includes a unique feature for detecting directional price squeezes.
- An integrated volatility measure helps avoid false signals and clarifies trend direction.
- Lastly, it alerts traders when a volume climax is likely reached during a move.
- This study primarily focuses on capturing momentum while concurrently alerting traders to shifting market dynamics, thereby aiding in the decision to either extend a position’s duration or optimize exit timing. The set of analytical tools, deployed alongside the trend-following indicator, are integrated to reflect the concepts outlined above. Furthermore, this framework utilizes distinctive methods for trend identification, consolidation recognition, directional squeeze assessment, and volume climax analysis—approaches that are not currently documented in publicly available resources.
Why Choose the Adaptive Sharp Momentum Study?
The Adaptive Sharp Momentum Study is a noise-free, trend-following indicator that automatically detects implied tops and bottoms within fast price cycles, potentially maximizing profitability. It identifies price consolidations and periods of indecision—often challenging to spot—striking a balance that enhances decision-making. Additionally, it aids in recognizing retracements and includes features for detecting directional price squeezes, allowing traders to stay in profitable trades longer. An integrated volatility measure helps avoid false signals and clarifies trend direction. Lastly, it alerts traders when a volume climax is likely reached during a move, providing a comprehensive toolset for day traders.
The issue with moving averages is that they work well in trends but when market is in consolidation, many false signals can be generated. The consolidation period acts as a second fast signal curve that helps eliminate the false signals generated through the standard adaptive moving average. This is basically done by measuring the momentum of the move itself through the Jurik RSX. There are other tools in this study that should also help the trader avoid false signals which will be fully described below and in the video demonstration in this thread.
Key Features and How They Work
1. Trend Following Consolidated Adaptive Moving Average:
At the core of the study is the Jurik Adaptive Average Curve, a fast-response adaptive moving average refined with an adaptive Relative Strength Index (RSX) function, known as Jurik RSX. This curve displays three trend modes—bullish, bearish, and indecisive—each customizable in color.
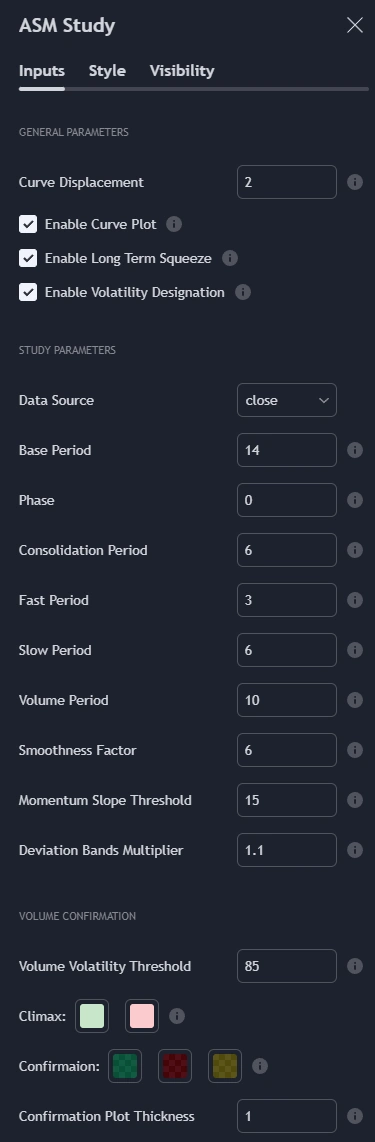
Users can adjust parameters such as the Phase and Consolidation Period:
- Phase: Influences the timing of trend signals, accommodating various trading styles. A lower phase value can produce leading signals, while a higher value may result in lagging signals.
- Consolidation Period: Helps filter out false signals. Optimize this period based on the time frame and instrument.
- Momentum Slope Threshold: As mentioned earlier, the Jurik moving average values are consolidated against the Dynamic Jurik RSX. Crossing the slope threshold of the Jurik RSX will trigger consolidation.

The main curve in the middle represents the overall trend. The issue with moving averages is that they work well in trends but when market is in consolidation, many false signals can be generated. The consolidation period acts as a second fast signal curve that helps eliminate the false signals generated through the standard adaptive moving average. This is basically done by measuring the momentum of the move itself through the Jurik RSX. There are other tools in this study that should also help the trader avoid false signals which will be fully described below.
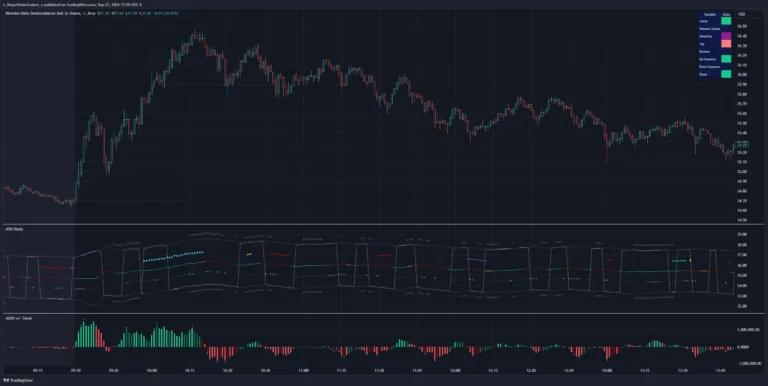
2. Implied Tops and Bottoms
The study also detects Implied Tops and Bottoms during market cycles using the Composite Momentum and Projections. It offers three detection modes:
- Strong Signals: Indicate significant potential reversal points.
- Medium Signals: Typically displayed near the end of a trend, suggesting traders should prepare to exit.
- Rolling Signals: Alert traders to set tight stop losses to secure profits, as the market may be approaching a turning point.
By default, the colors of Rolling Signals and Medium Signals are the same for simplicity.
Note the following:
- The fast and slow period have the most effect on implied tops and bottoms detection.
- Adjusting the main period will also have an overall effect.

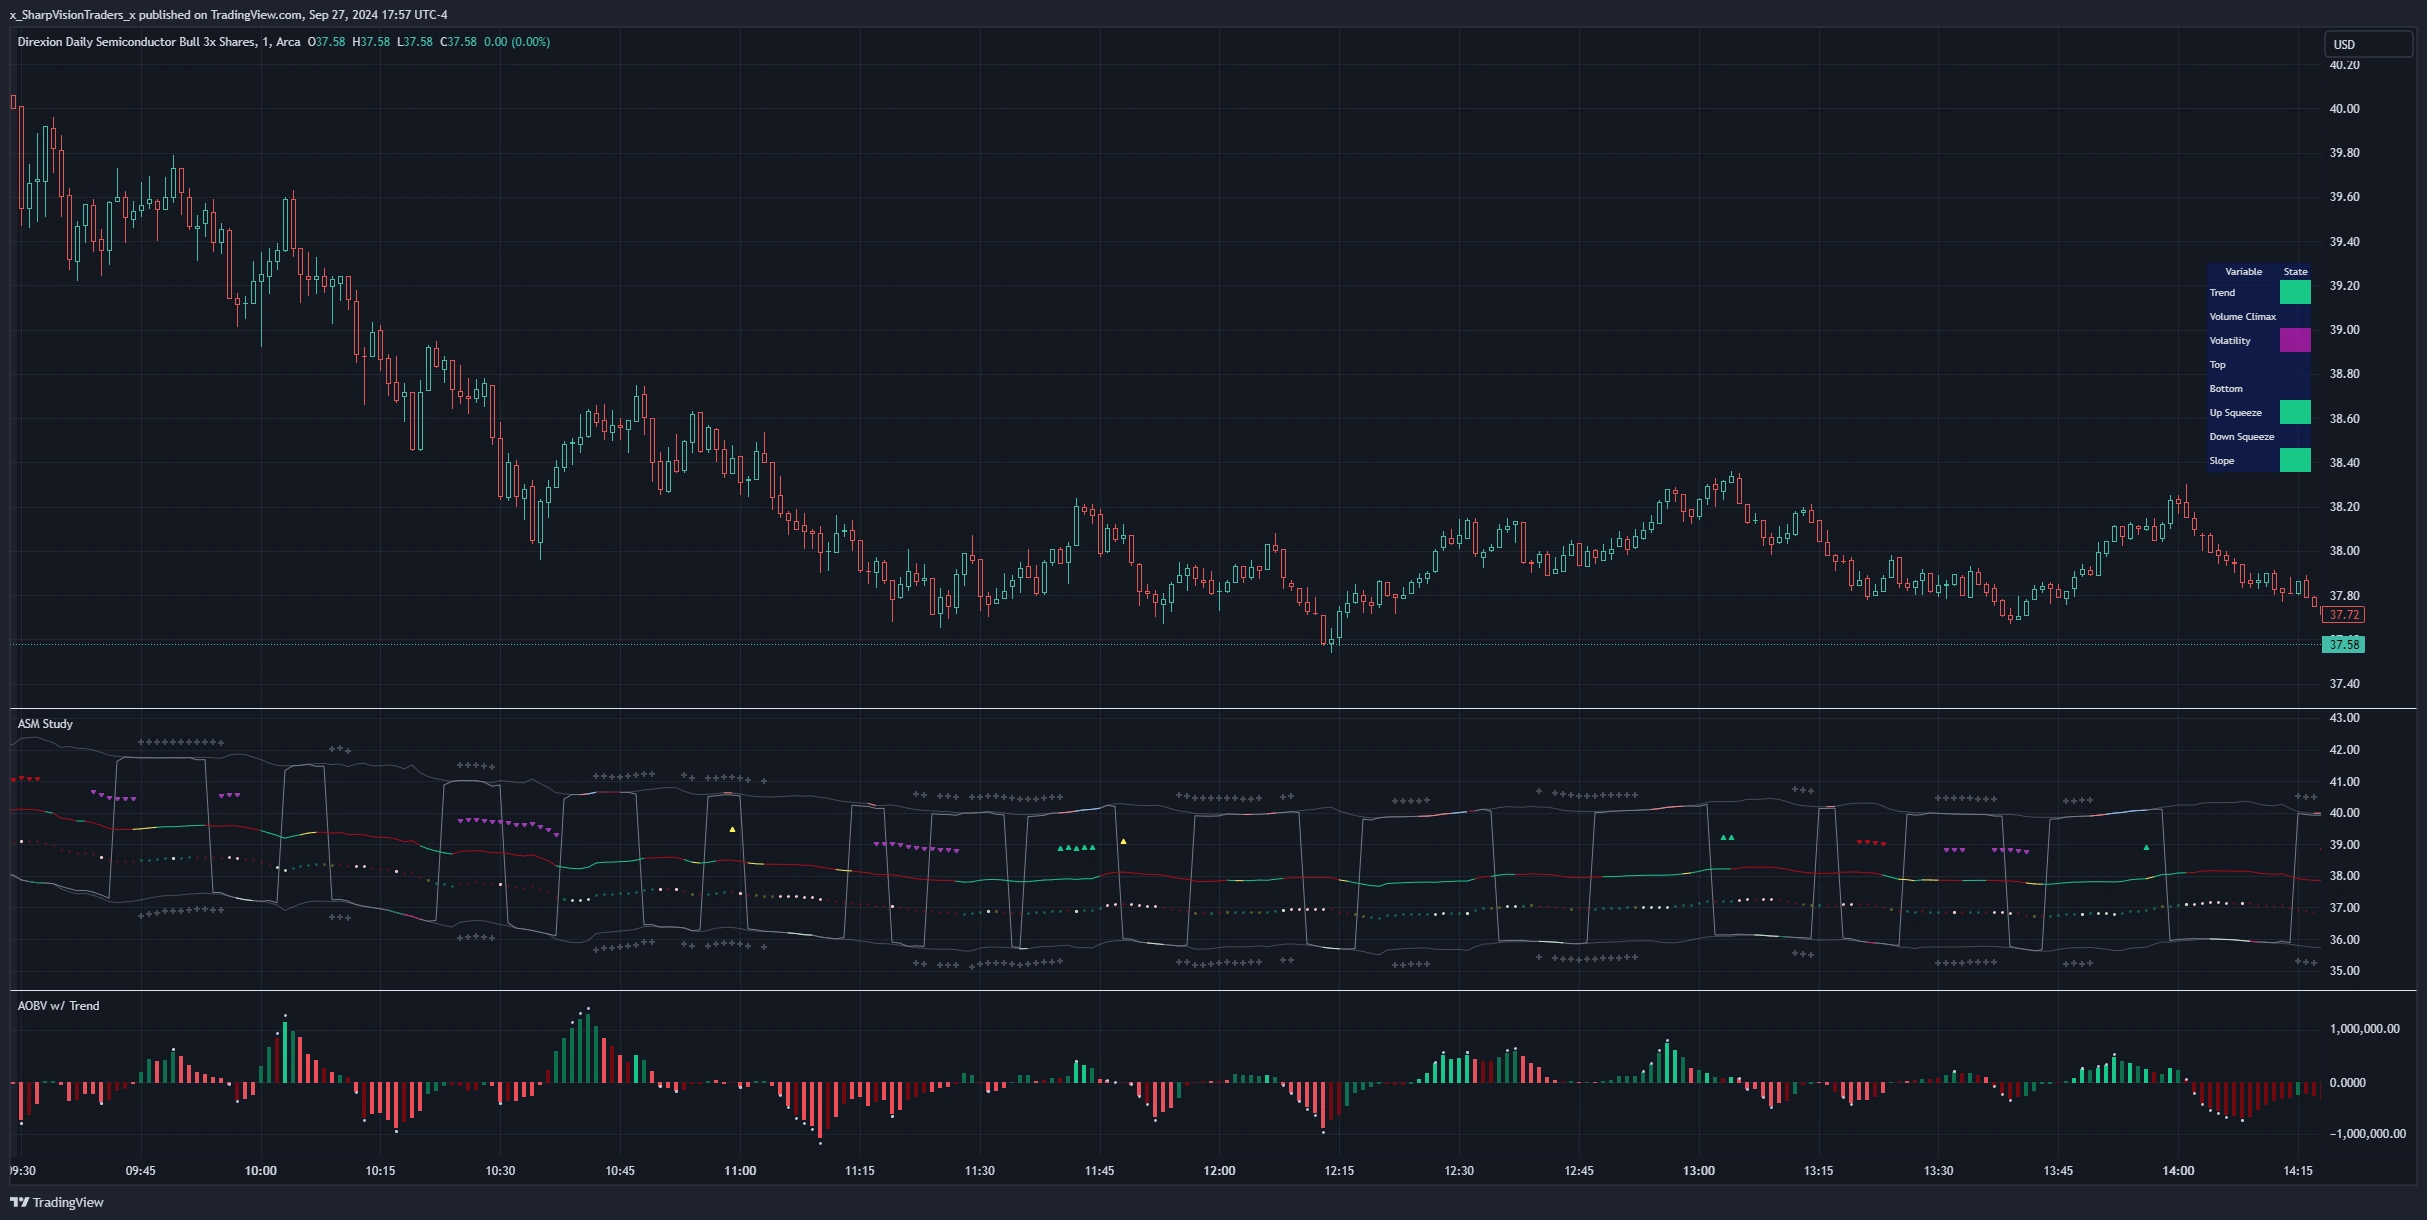
The above chart shows rolling tops, rolling bottoms, strong tops, and strong bottoms. A rolling top of bottom indicate an increase in momentum in that direction and thus a tight stoploss would be recommended, while a strong top/bottom indicates that an exit is warranted.
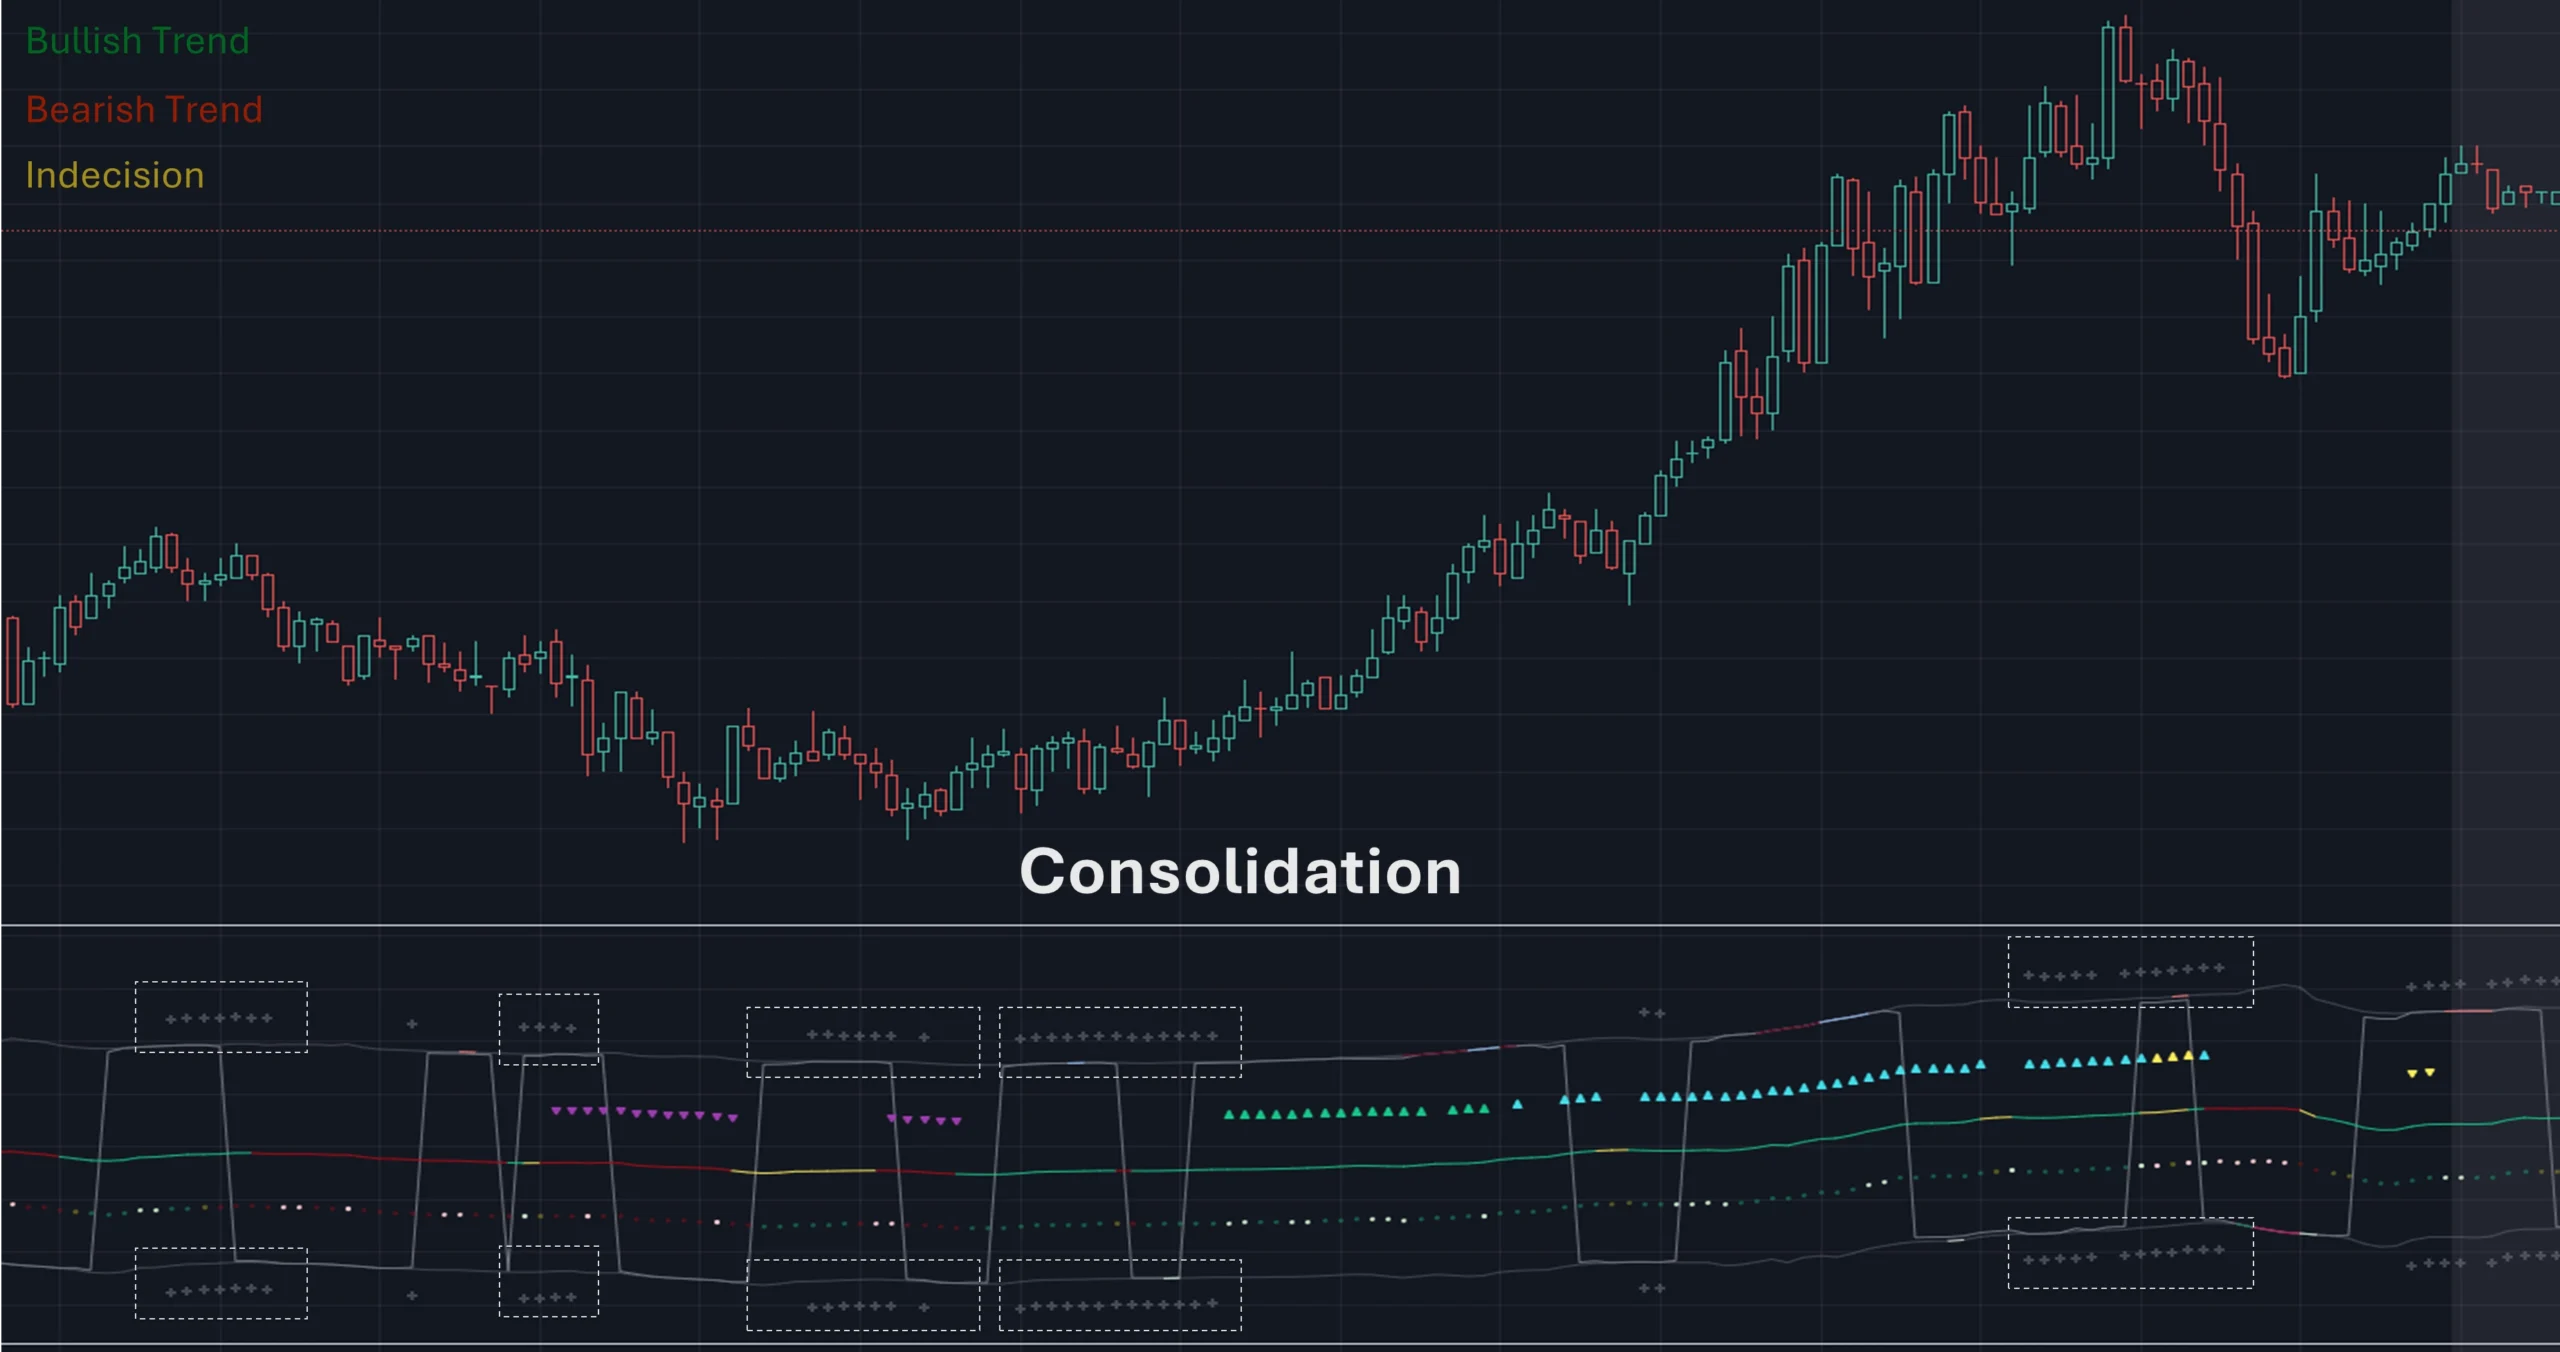
3. Consolidation and Volatility
If enabled, '+' will appear above the ceiling and floor plots if consolidation is detected. Consolidation is detected by using lookback function that determine if price is below a threshold or not. If below, then consolidation would be confirmed. This is accomplished by adjusting the 'Price Consolidation Threshold' period

The above chart demonstrates detection of consolidation on a 1-minute chart. Also, note the ceiling and floor plot, it expands when volatility is high.
Consolidation detection helps weed out long and short signals indicated by the main curve.
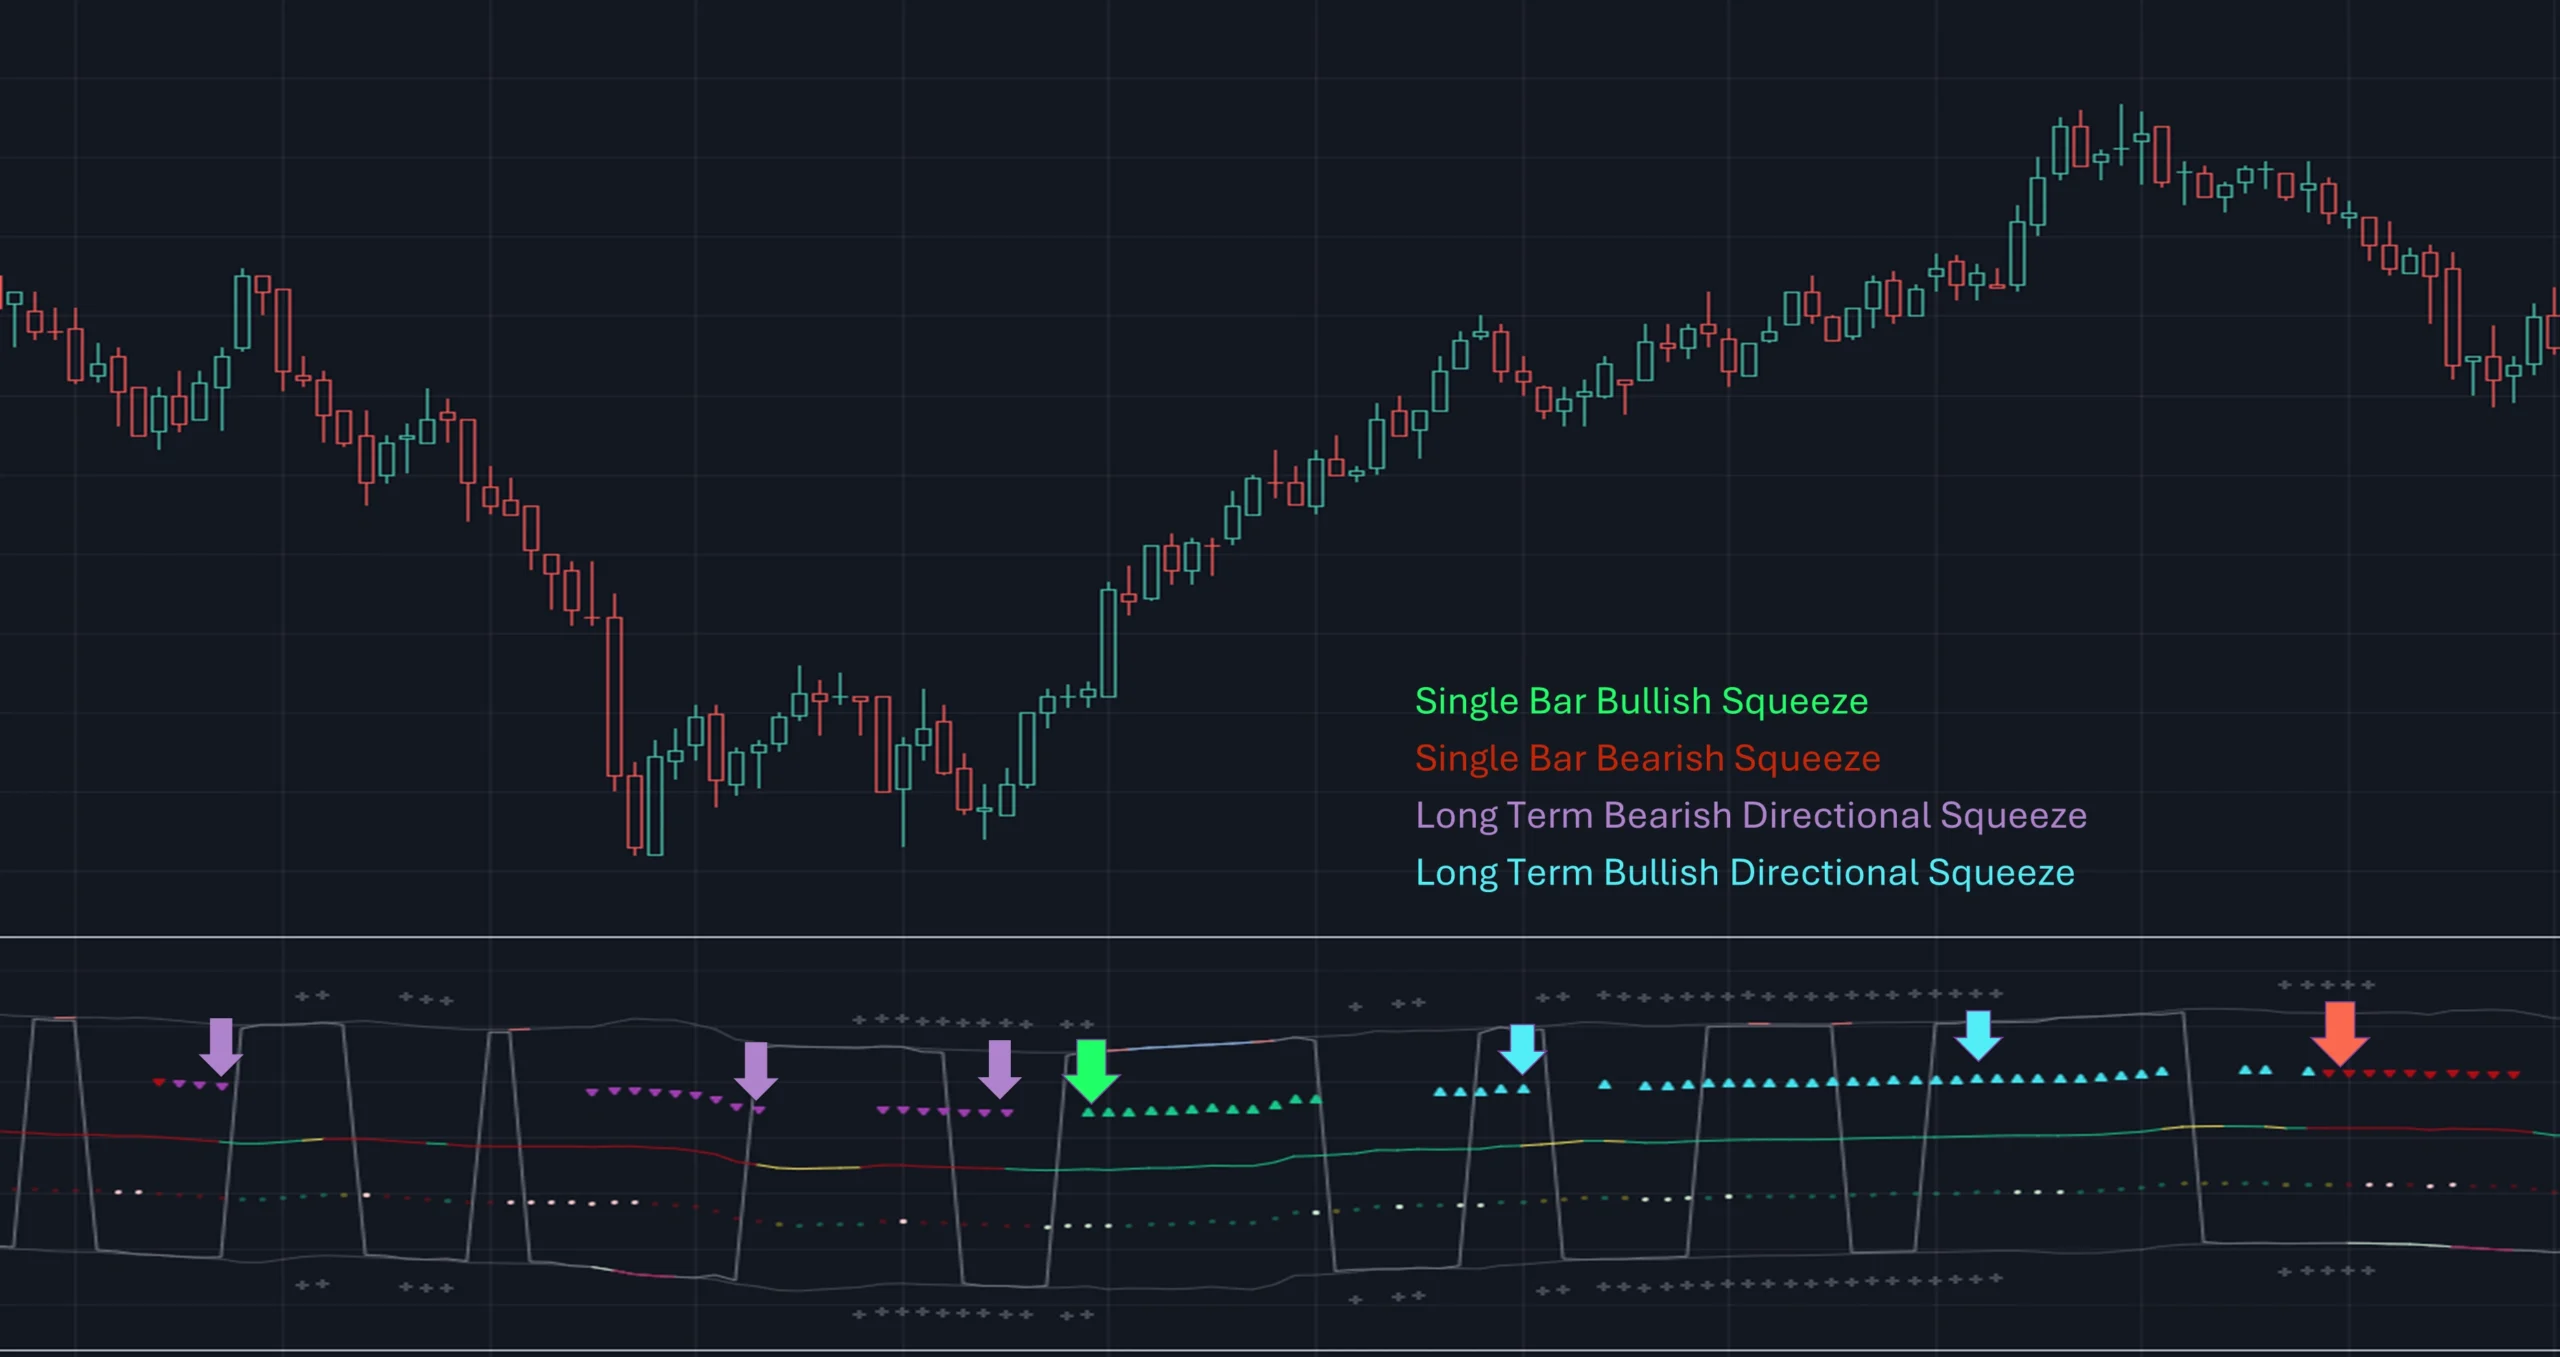
4. Directional Squeeze
Another unique feature of this indicator is the detection of directional price squeeze. Directional squeeze is defined as a price push in the direction indicated by momentum whether upward or downward. This is different from the common squeeze indicators found on the web since this one is detecting a directional push.
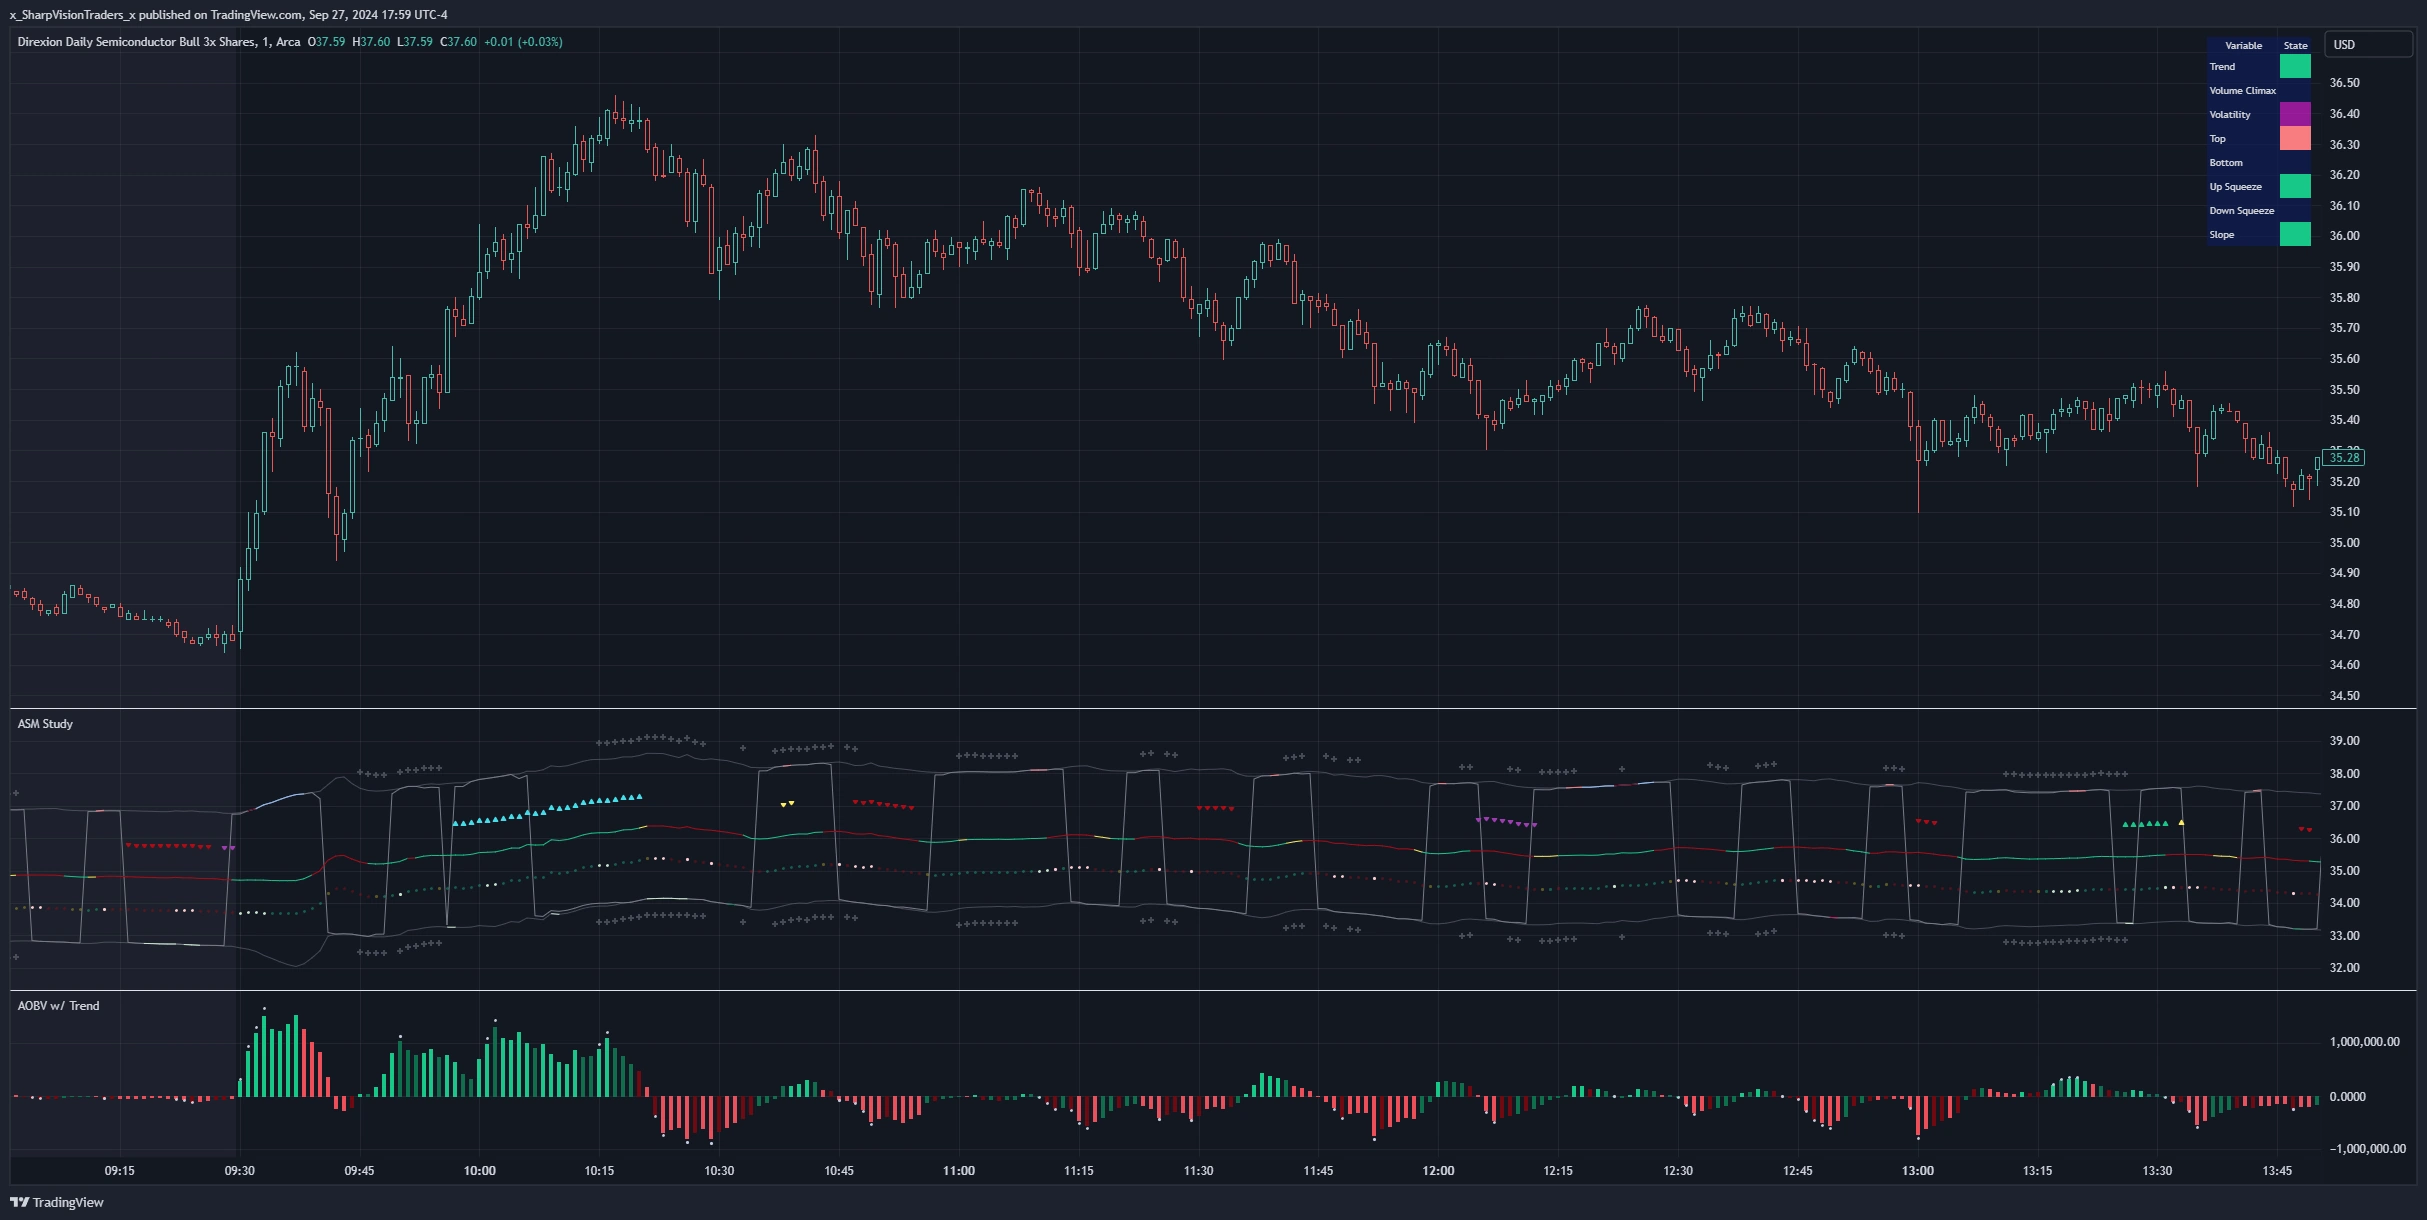
The Directional Squeeze feature, indicated by up and down triangles above the main curve, highlights strong trends in the market's current direction:
- Trend Continuation: Allows traders to stay in profitable trades longer during strong trending markets.
- Multiple Modes: Offers single-bar (short-term) and longer-term squeezes. Single-bar squeezes can signal potential market reversals, while longer-term squeezes are useful in sustained trends.
Be mindful that under certain conditions, the directional squeeze could be directionless(sideways) if consolidation is outlined by the indicator. This is another useful feature the trader could utilize. The chart above mostly demonstrates directional squeeze but directionless can also be observed.
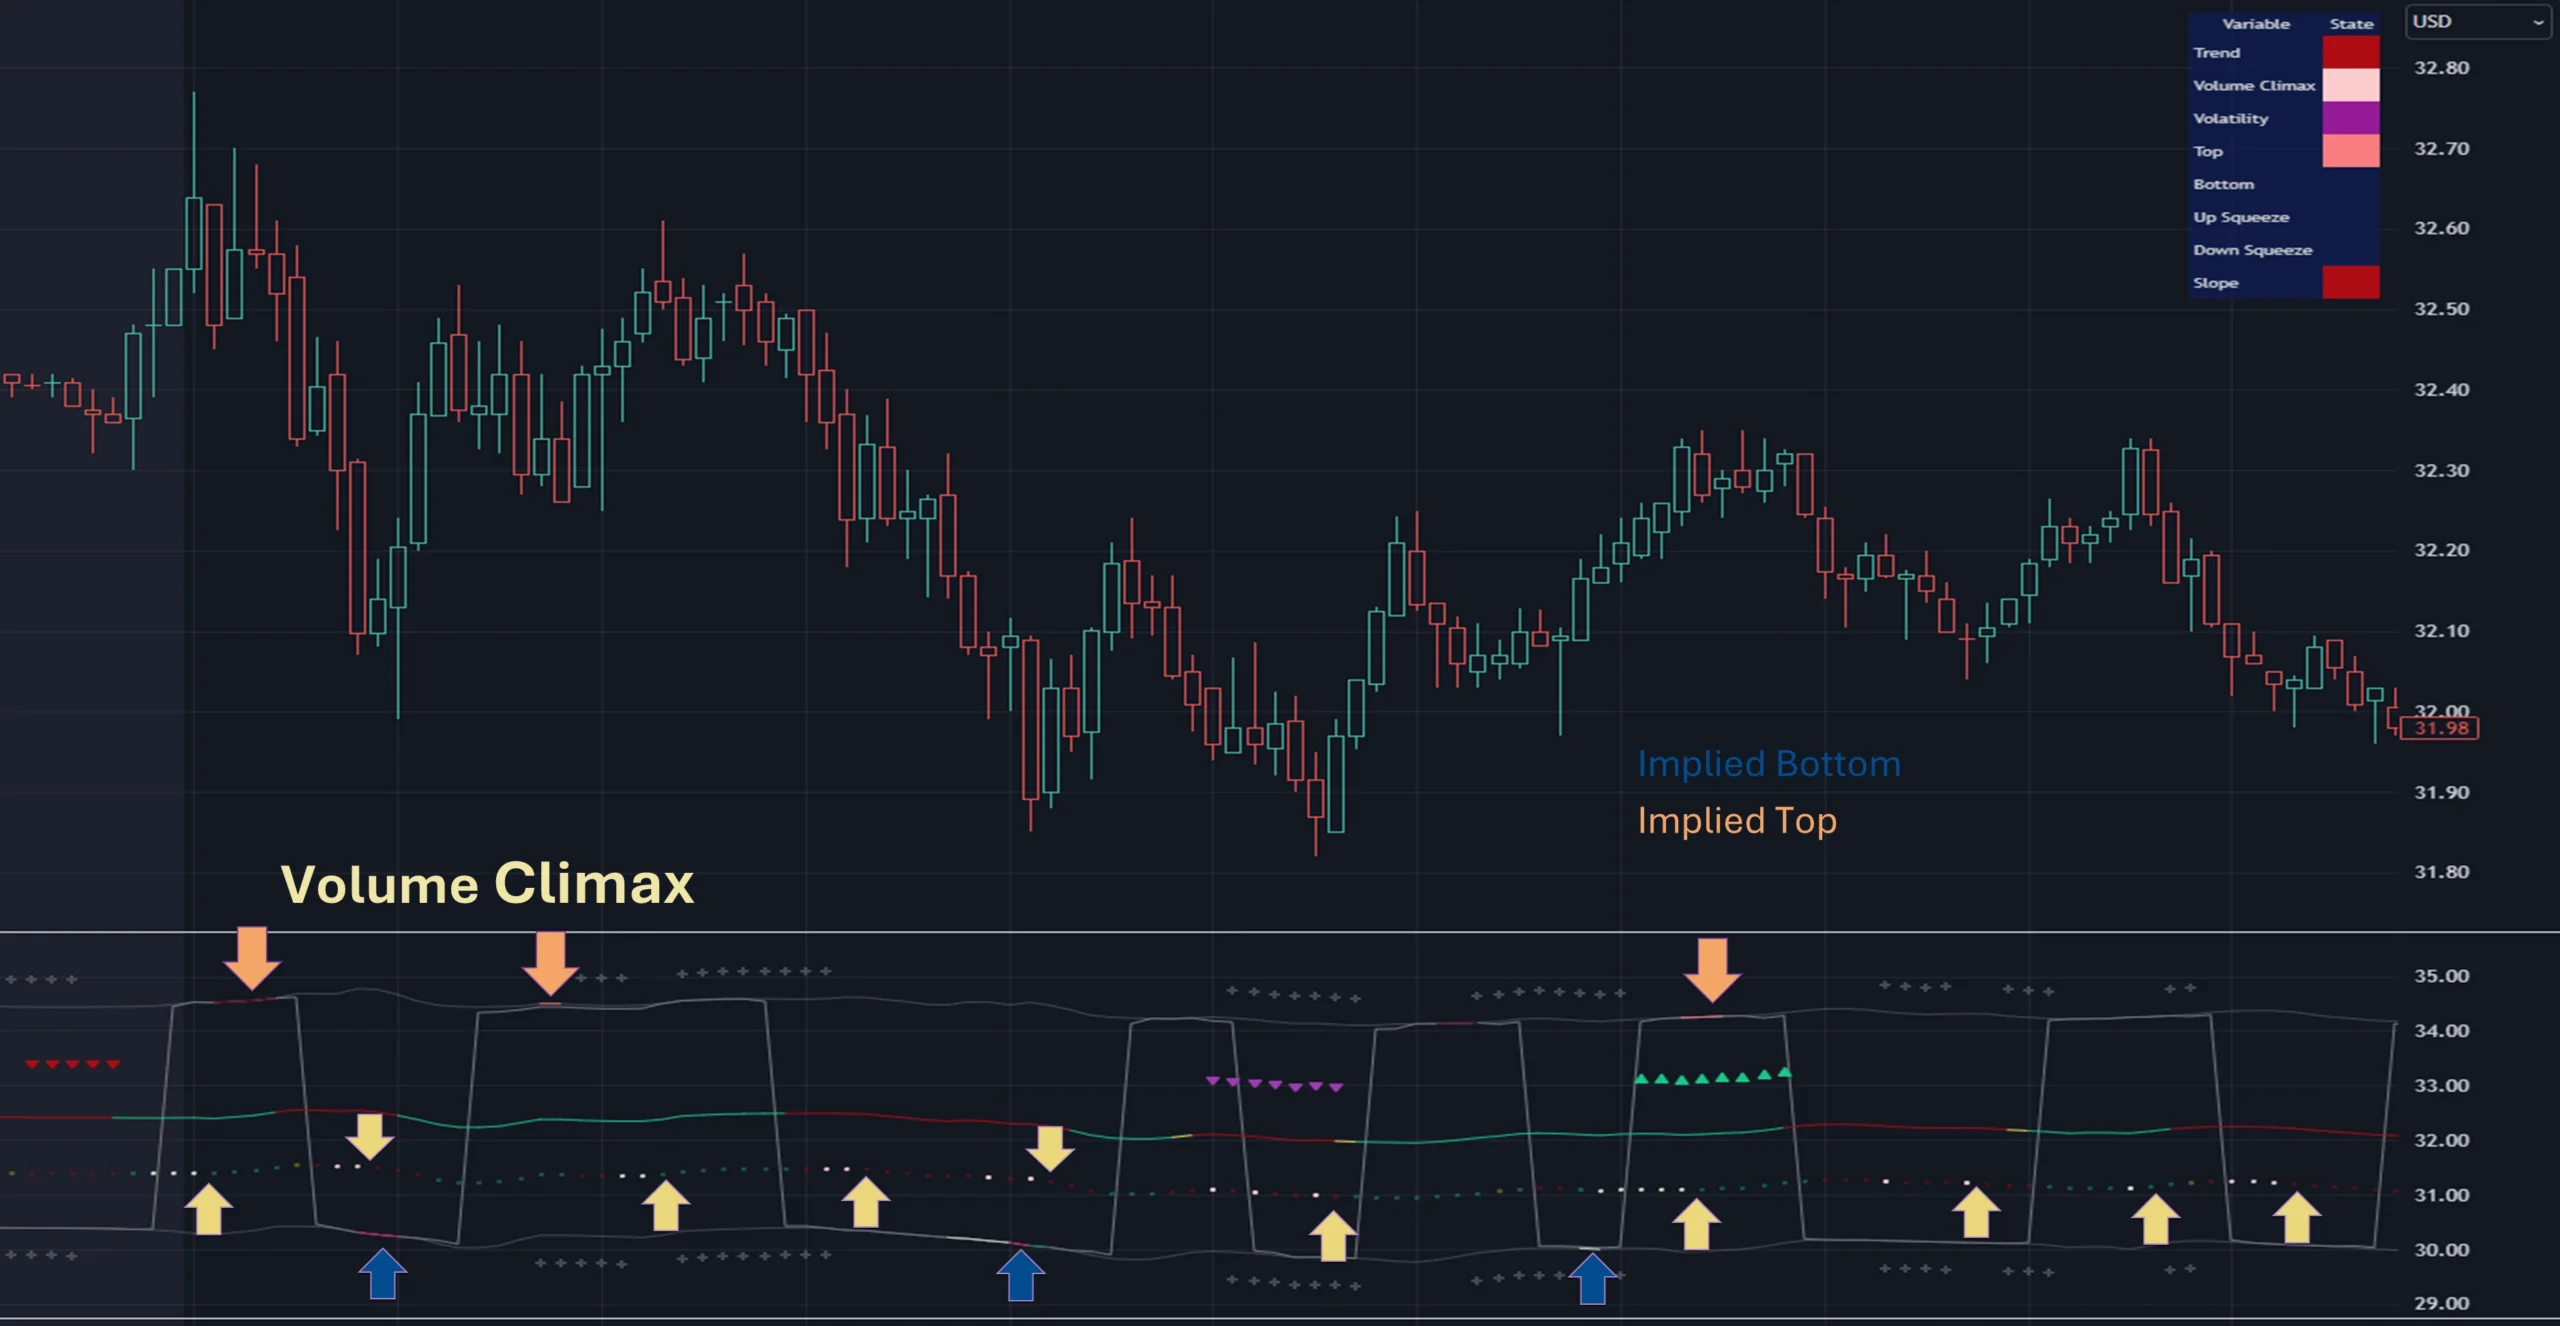
5. Volume Volatility and Volume Climax Detection
An essential feature of the Adaptive Sharp Momentum Study is its ability to measure Volume Volatility and detect Volume Climax moments:
- Volume Volatility Measure: Integrated into the study to help avoid false signals by assessing the strength of market moves. It provides better clarity on trend direction by indicating when the market is experiencing significant volume changes.
- Volume Climax Alerts: The study alerts traders when a volume climax is likely reached during a move, which is helpful for identifying potential reversal points or the culmination of a trend. Brighter confirmation signal dots indicate these climaxes, helping traders make timely entry/exit decisions.
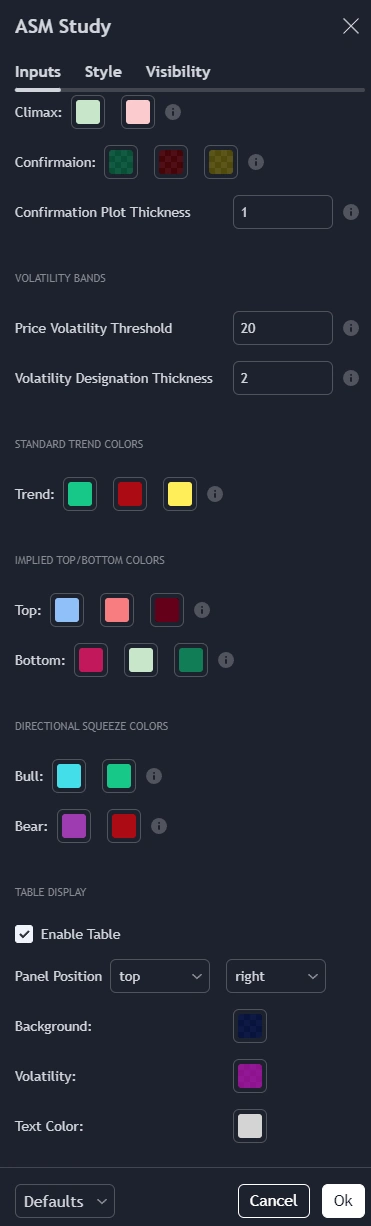
- Adjustable Parameters: Traders can set the Volume Volatility Threshold and adjust the Volume Lookback Period to tailor the sensitivity of volume climax detection according to their trading strategy.
5. The indicator contains other useful features:
- Cycles: Helps determine when to enter long or short trades based on upward or downward market cycles. It also aids in recognizing retracement levels during a trend, allowing traders to capitalize on brief counter-trend movements. Those cycles can be observed as the up and down gray lines on the chart.
- Real-Time Table: The table is another visual aid that summarizes the status of each feature in real-time.
How to Use this Study Effectively
The main curve in the middle is your final decision point. Prior to entering a trade look for the following:
- Is the market in consolidation? If yes, then you'd be advised not to enter the trade until the study clearly shows no consolidation.
- Is the ceil or floor plots showing a strong top or bottom, or even a volume climax in the direction to intend to enter? If yes, then either ensure you enter at a tight stop or don't enter.
- Is there an indication of a directional squeeze with no consolidation or volume climax? Then this would be an ideal place to enter. Be mindful though that entering directional squeeze too late is not recommended.
- Once you are in the trade, look at consolidation, implied tops and bottoms, and volume climax to determine exit point. You will quickly realize if you entered a trade prematurely.
- Utilize the directional squeeze and the prevalent trend to help you stay in the trade longer.
- Adjust your stop losses depending on whether you are seeing a rolling implied top/bottom or a strong top/bottom.
- Also, at volume climaxes, be ready to exit. The approach with volume climax detection should be the same as the implied tops/bottoms.
Below is a chart demonstrating trading on a 1-minute chart. The study could be used for any time frame:

** Important Note **
This study relies on volume readings. Incorrect evaluation will be concluded without proper volume data.
How These Components All Work Together?
The Adaptive Sharp Momentum Study integrates multiple components to provide a framework for analyzing market dynamics. Each feature addresses specific challenges in trading:
- Core Trend Identification: The Jurik Adaptive Moving Average (JMA) and Jurik RSX ensure better trend detection by reducing noise and dynamically confirming momentum, thus minimizing lag and false signals.
- Implied Tops and Bottoms: The combination of Composite Momentum and Laguerre Dynamic Projection Bands highlights critical turning points. This dual-layered approach identifies potential reversals and key support/resistance levels with improved clarity.
- Consolidation and Volatility: Adaptive ceilings, floors, and consolidation detection filter out indecisive market phases. This helps avoid unreliable signals and provides a better perspective on potential breakouts or continuations.
- Directional Squeeze: The Directional Squeeze feature identifies directional bias in price compression. Its dynamic thresholds adapt to market conditions, aiding in the assessment of strong directional moves.
- Volume Climax: Volume volatility and climax detection highlight key moments of market activity, aiding in the evaluation of trend strength and potential turning points.
Integrated Framework: The integration of these components creates a system where each element complements the others.
This study offers a methodical approach to analyzing trends, momentum, and volatility while filtering noise. It is a tool designed to assist traders in navigating complex market conditions.
About Adaptive Sharp Vision (ASM) Study Utilization
- The study is intended for day traders who rely on momentum for quick entry and exits but it still has the tools to allow for trend trading.
- The trader is advised to utilize our Adaptive On Balance Volume indicator for help gain a real-time visual of market movements.
- Risk management is essential. Even if a trader chooses not to use a stop order, they should not rely solely on intuition. This study measures momentum in real-time and incorporates historical data. The benefits include a lag-free trend indicator and additional tools that help traders either stay in a trade to maximize profits or exit quickly to minimize losses.
Review the screenshots and video for setup options.
Click here for a list of all of TradingView's downloads.