sharp vision traders
Enhancing Your Trading Experience

Correlation Trend (TV)
- Categories: Indicator, TradingView
- Tags: Correlation, Spearman, Trend
- Type: Free
The Spearman Correlation Trend Indicator for TradingView measures the strength and direction of a trend by ranking variables and assessing their correlation.
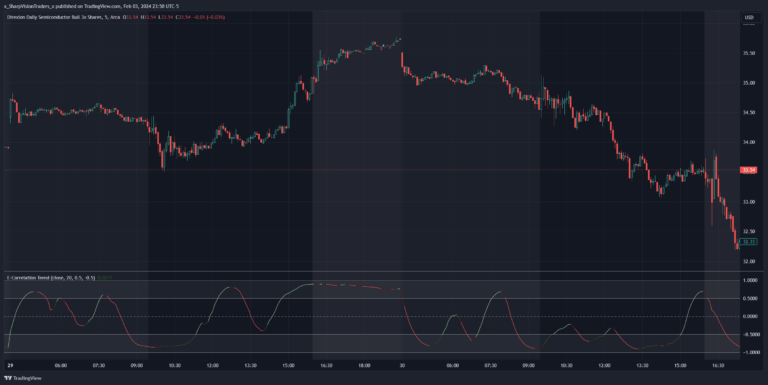
Another interesting Correlation Trend indicator utilizing Spearman's statistical correlation. Particularly, the indicator will help with two things, the direction of the trend and the strength of the trend. A value in between designates a ranging market. Below is a snapshot of how to interpret this:
- Values higher than +0.5 signify uptrend conditions.
- Values lower than -0.5 signify downtrend conditions.
- Sideway conditions could be spotted if within the -0.5 to +0.5 window.
The indicator range is +1 to -1.
We have also devised a simple algorithm to aid the trader in determining whether momentum is weakening, maintaining strength, or strengthening. This is in order to take advantage of price reversal. However, it is recommended to utilize this with a sound momentum indicator to confirm the signal.
Correlation Trend Features:
- Custom data input.
- Custom simple algorithm to help determine price momentum.
- Smoothing can be applied to the main curve.
Review the screenshots for setup options. Additionally, the user can review a video demonstration of this indicator on other trading platforms.
Click here for a list of all of TradingView's downloads.

