sharp vision traders
Enhancing Your Trading Experience

SVE Stochastic RSI (NT)
- Categories: Indicator, NinjaTrader
- Tags: Oscillator, RSI, Stochastic
- Type: Free
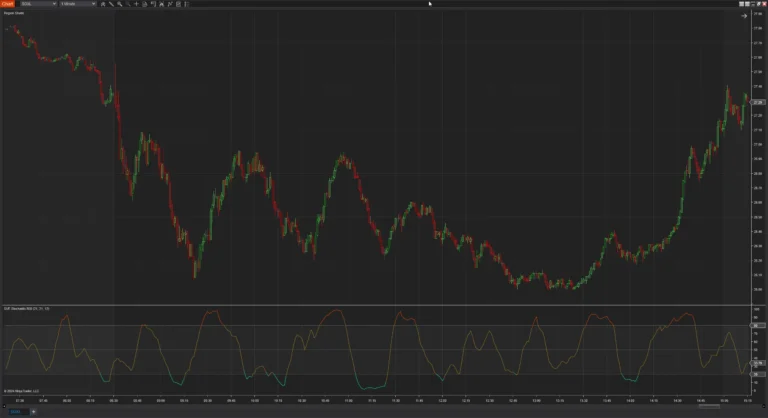
The SVE Stochastic RSI for NinjaTrader is an oscillator that calculates the average relative position of the RSI rather than their position within the high-low range.
Note: This download requires NinjaTrader 8 release 8.1.3 or newer.
Introduction to the SVE Stochastic RSI Indicator
The SVE Stochastic RSI for NinjaTrader is an advanced oscillator that modifies the traditional Stochastic RSI by calculating the average relative position of the RSI values rather than just their position within the high-low range. By replacing the regular high-low range with its average value, the SVE Stochastic RSI accounts for more data points, resulting in a smoother and potentially more accurate indicator.
Key Differences from Traditional Stochastic RSI
- Average Relative Position: Unlike the standard Stochastic RSI that uses the current RSI value's position within its recent high and low, the SVE version calculates the average relative position. This approach reduces the noise and volatility commonly associated with oscillators.
- Smoothing Effect: By utilizing average values, the SVE Stochastic RSI provides a smoother curve, making it easier to interpret and reducing the likelihood of false signals.
How Does SVE Stochastic RSI Work?
The SVE Stochastic RSI combines elements of the Relative Strength Index (RSI) and the stochastic oscillator but enhances them through averaging techniques. Here's a simplified breakdown:
- Calculate the RSI: Determine the RSI over a specified period.
- Determine High and Low Averages: Instead of using the highest and lowest RSI values over the period, calculate their averages.
- Compute the Oscillator: Calculate the average relative position of the RSI within these averaged high and low values.
- Apply Smoothing: Use selected averaging methods to smooth out the oscillator's line further.
Customizable Features of the SVE Stochastic RSI Indicator
One of the standout features of the SVE Stochastic RSI is its high level of customization, allowing traders to tailor the indicator to their specific trading style and the assets they trade.
1. Data Input Source
- Options: Close, High-Low Average (HL2), High-Low-Close Average (HLC3), Open-High-Low-Close Average (OHLC4), VWAP, and more.
- Benefit: Choose the price input that best represents the market dynamics of the asset you're trading.
2. RSI Period and Averaging Methods
- RSI Period: Adjust the number of periods used in the RSI calculation.
- Averaging Methods: Select from various methods such as Simple Moving Average (SMA), Exponential Moving Average (EMA), Hull Moving Average (HMA), Weighted Moving Average (WMA), and more.
- Benefit: Fine-tune the sensitivity and responsiveness of the RSI component to match market conditions.
3. Stochastic Period and Averaging Methods
- Stochastic Period: Set the period over which the stochastic calculation is performed.
- Averaging Methods: Similar to the RSI averaging options, allowing for additional smoothing.
- Benefit: Control the oscillator's smoothness and reduce potential false signals.
4. Upper and Lower Limits
- Customizable Levels: Set the overbought (upper limit) and oversold (lower limit) thresholds according to your trading strategy.
- Benefit: Identify potential reversal zones more accurately.
5. Visual Enhancements
- Shade Application: Apply shading to the indicator chart to highlight overbought and oversold zones.
- Color Customization: Choose different colors for the upper and lower zones for easy visualization.
- Opacity Settings: Adjust the transparency of the shading to prevent it from overpowering the chart.
- Benefit: Enhance the visual appeal and readability of the indicator, making it easier to interpret signals quickly.
How to Use the SVE Stochastic RSI in Your Trading
Identifying Overbought and Oversold Conditions
- Overbought Zone: When the oscillator moves above the upper limit (e.g., 80), it indicates that the asset may be overbought and a price correction could be imminent.
- Oversold Zone: When the oscillator falls below the lower limit (e.g., 20), it suggests that the asset may be oversold and could be due for a rebound.
Spotting Divergences
Look for discrepancies between the price action and the oscillator:
- Bullish Divergence: Price makes a new low, but the oscillator makes a higher low, indicating potential upward momentum.
- Bearish Divergence: Price makes a new high, but the oscillator makes a lower high, signaling possible downward pressure.
Confirming Trends
Use the SVE Stochastic RSI in conjunction with trend analysis:
- Uptrend Confirmation: In an uptrend, consider long positions when the oscillator pulls back to the oversold zone and then rises above it.
- Downtrend Confirmation: In a downtrend, consider short positions when the oscillator moves into the overbought zone and then falls below it.
Advantages of Using the SVE Stochastic RSI
- Reduced Noise: The use of average values smooths out the oscillator, making it less susceptible to false signals caused by market volatility.
- Customization: The ability to adjust periods and select averaging methods allows for a highly personalized indicator.
- Early Signals: By smoothing the data, the indicator can sometimes provide earlier signals compared to traditional oscillators.
Review the screenshots and video for setup options.
Click here for a list of all of NinjaTrader's Downloads.

Screenshots
Media
