
sharp vision traders
Enhancing Your Trading Experience

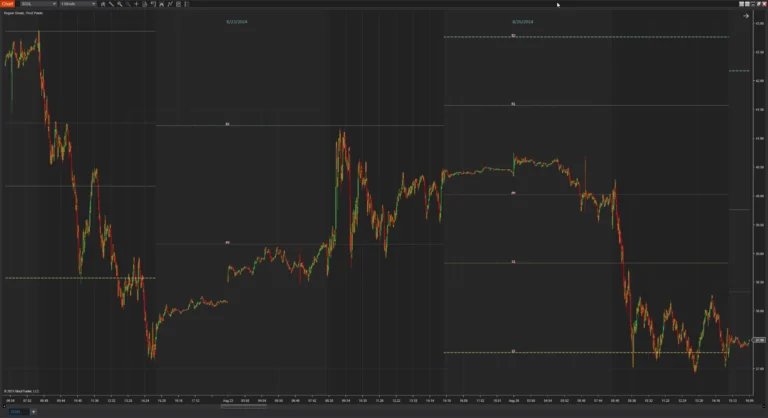
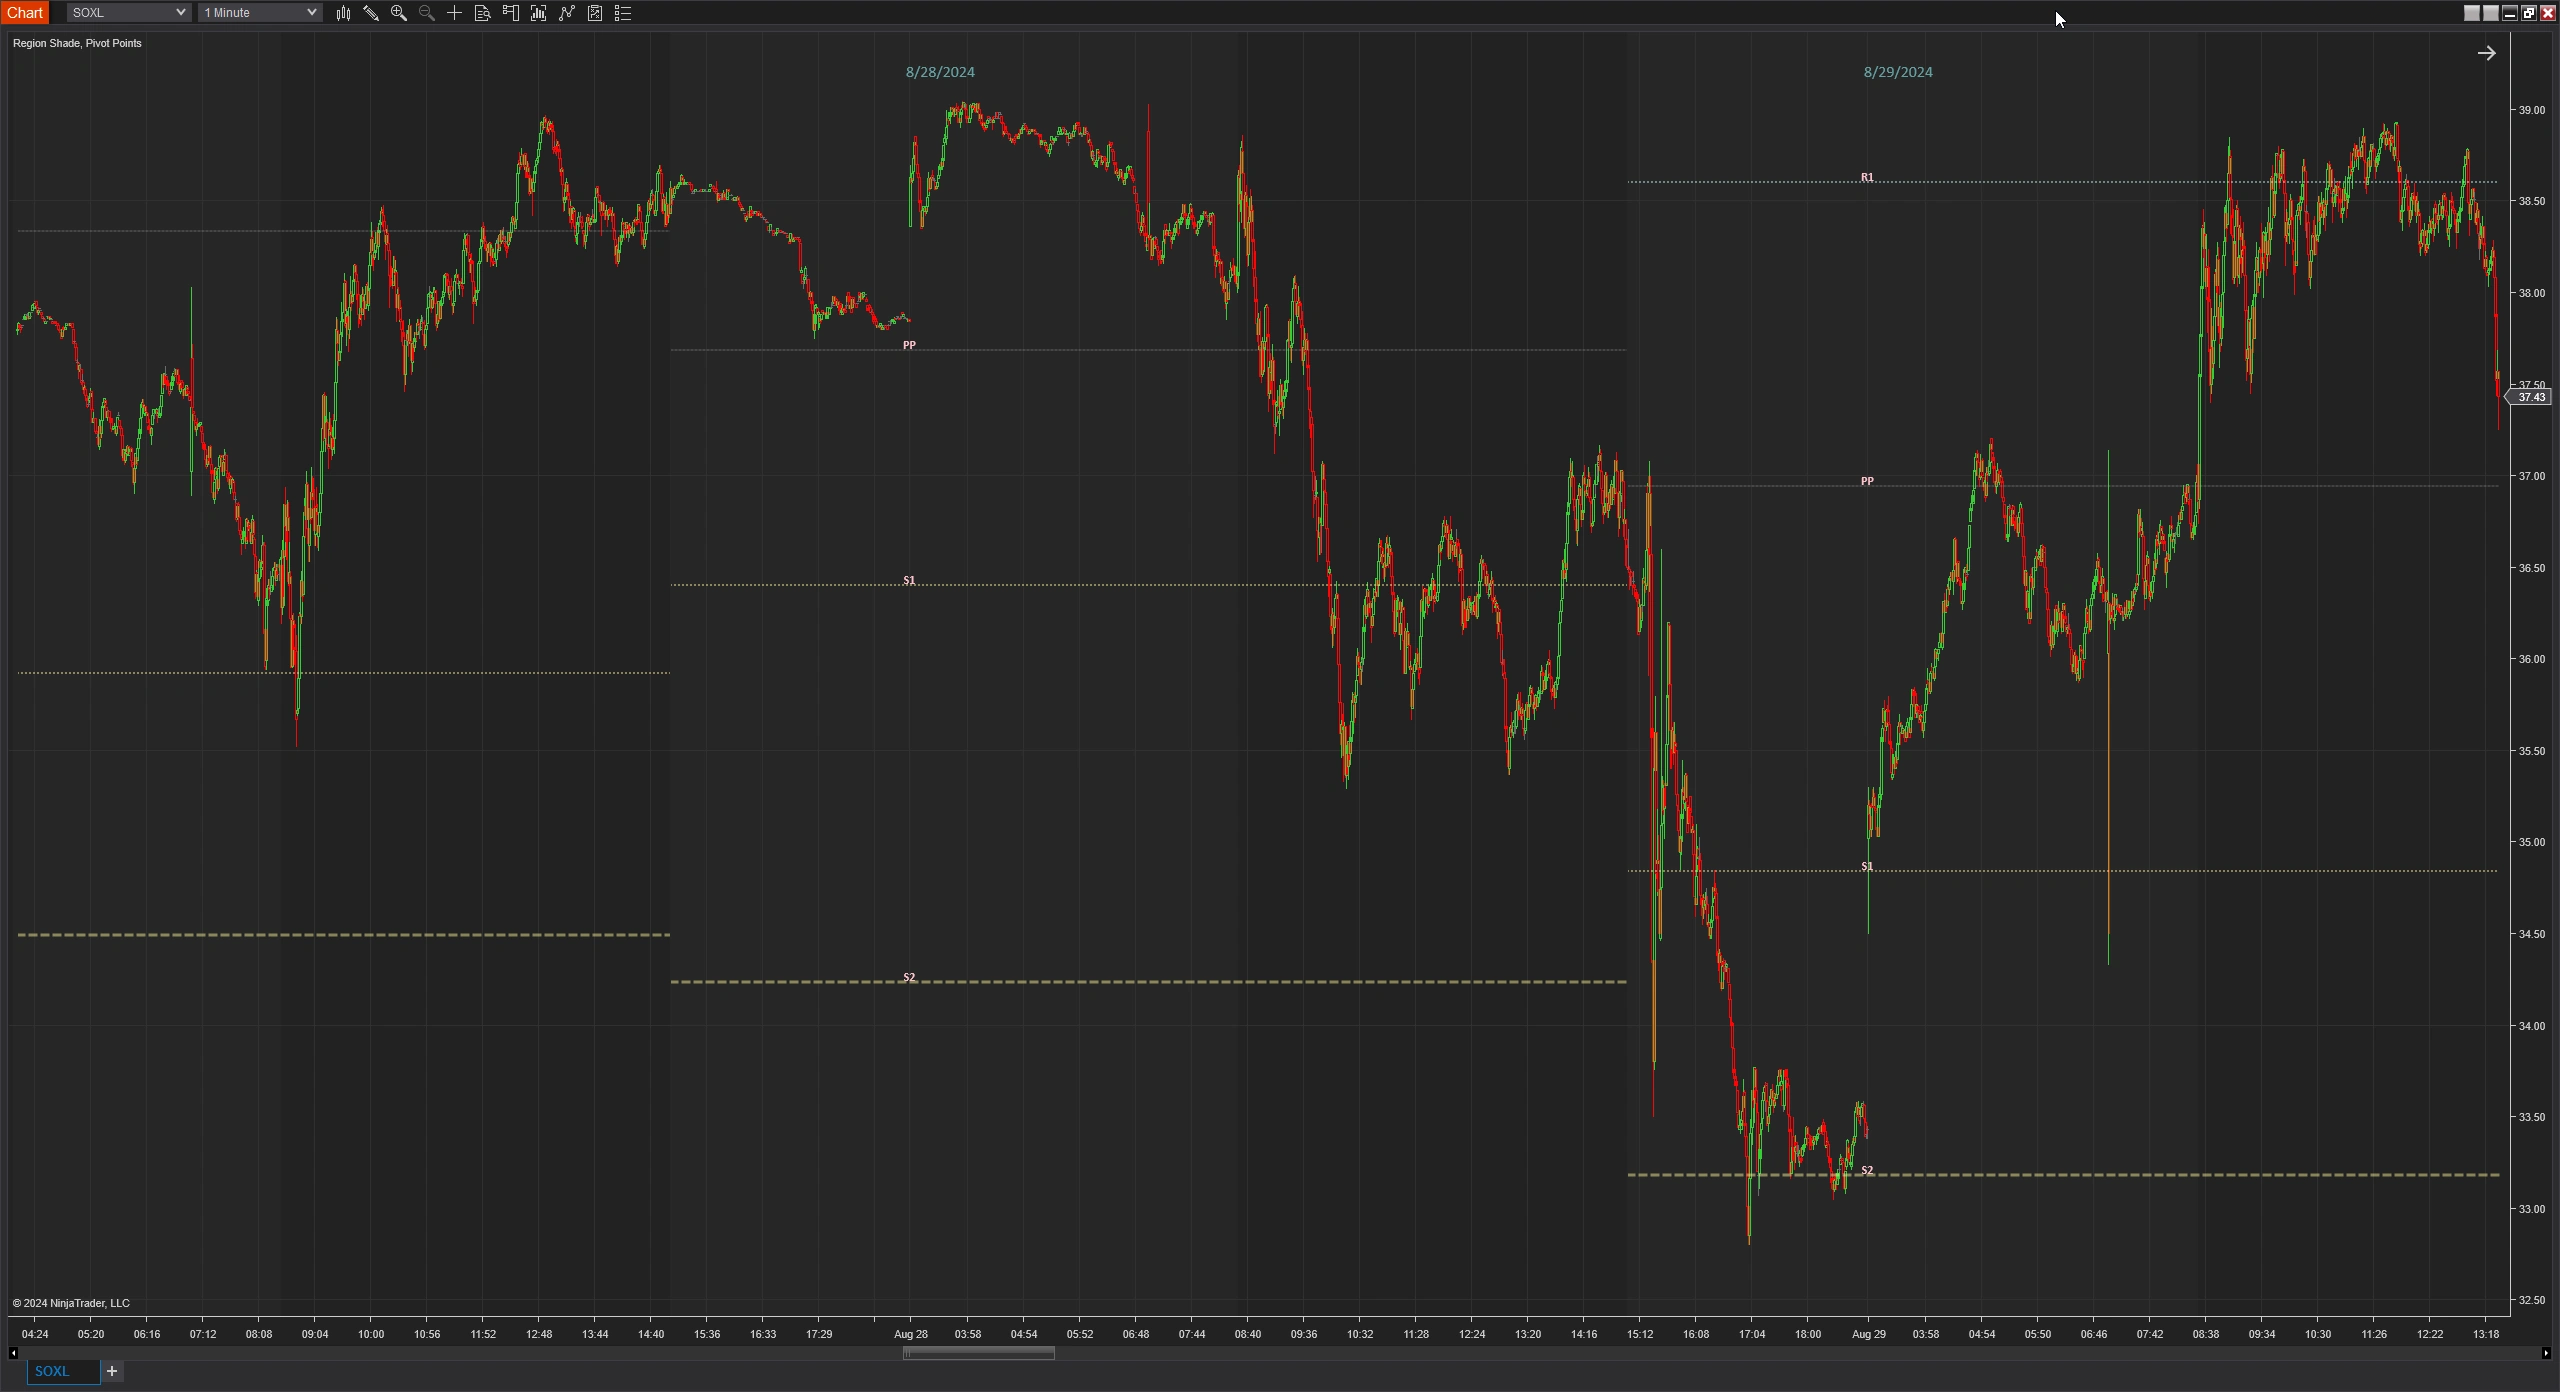
Pivot Points (NT)
- Categories: Indicator, NinjaTrader
- Tags: Pivots
- Type: Free
Pivot points indicator for NinjaTrader are widely used in technical analysis to help traders identify potential support and resistance levels in the market.
Note: This download requires NinjaTrader 8 release 8.1.3 or newer.
Understanding Standard Pivot Points: A Guide for Traders
Pivot points are widely used in technical analysis to help traders identify potential support and resistance levels in the market. By calculating these levels based on previous trading data, traders can make decisions about where to enter and exit trades. This guide will explain what standard pivot points are, how they are calculated, and how you can use them in your trading strategy.
What Are Pivot Points?
Pivot points are price levels calculated using the high, low, and closing prices of a previous trading period, usually the previous day. These levels serve as indicators of where the price might encounter support (a price level where buying interest may overcome selling pressure) or resistance (a price level where selling interest may overcome buying pressure) in the current trading session.
- Bullish Signal: If the market opens above the pivot point, it may indicate a bullish sentiment.
- Bearish Signal: If the market opens below the pivot point, it may suggest a bearish sentiment.
How Are Pivot Points Calculated?
The standard pivot point (PP) is calculated as the average of the previous period's high, low, and close prices:
PP = (High + Low + Close) / 3
Once the pivot point is established, support and resistance levels are calculated:
- First Support (S1):
S1 = (2 * PP) - High
- Second Support (S2):
S2 = PP - (High - Low)
- First Resistance (R1):
R1 = (2 * PP) - Low
- Second Resistance (R2):
R2 = PP + (High - Low)
These levels help traders anticipate where the price might change direction.
Using Pivot Points in Trading
Pivot points can be used in several ways:
- Determining Market Trend: By observing where the current price is relative to the pivot point, traders can gauge market sentiment.
- Trading above the pivot point suggests a bullish trend.
- Trading below the pivot point indicates a bearish trend.
- Identifying Entry and Exit Points: Support and resistance levels serve as potential points for entering or exiting trades.
- Buying Opportunity: Near support levels if the market is expected to rise.
- Selling Opportunity: Near resistance levels if the market is expected to fall.
- Setting Stop-Loss and Take-Profit Orders: Pivot levels can help determine logical points for placing stop-loss orders to manage risk and take-profit orders to secure gains.
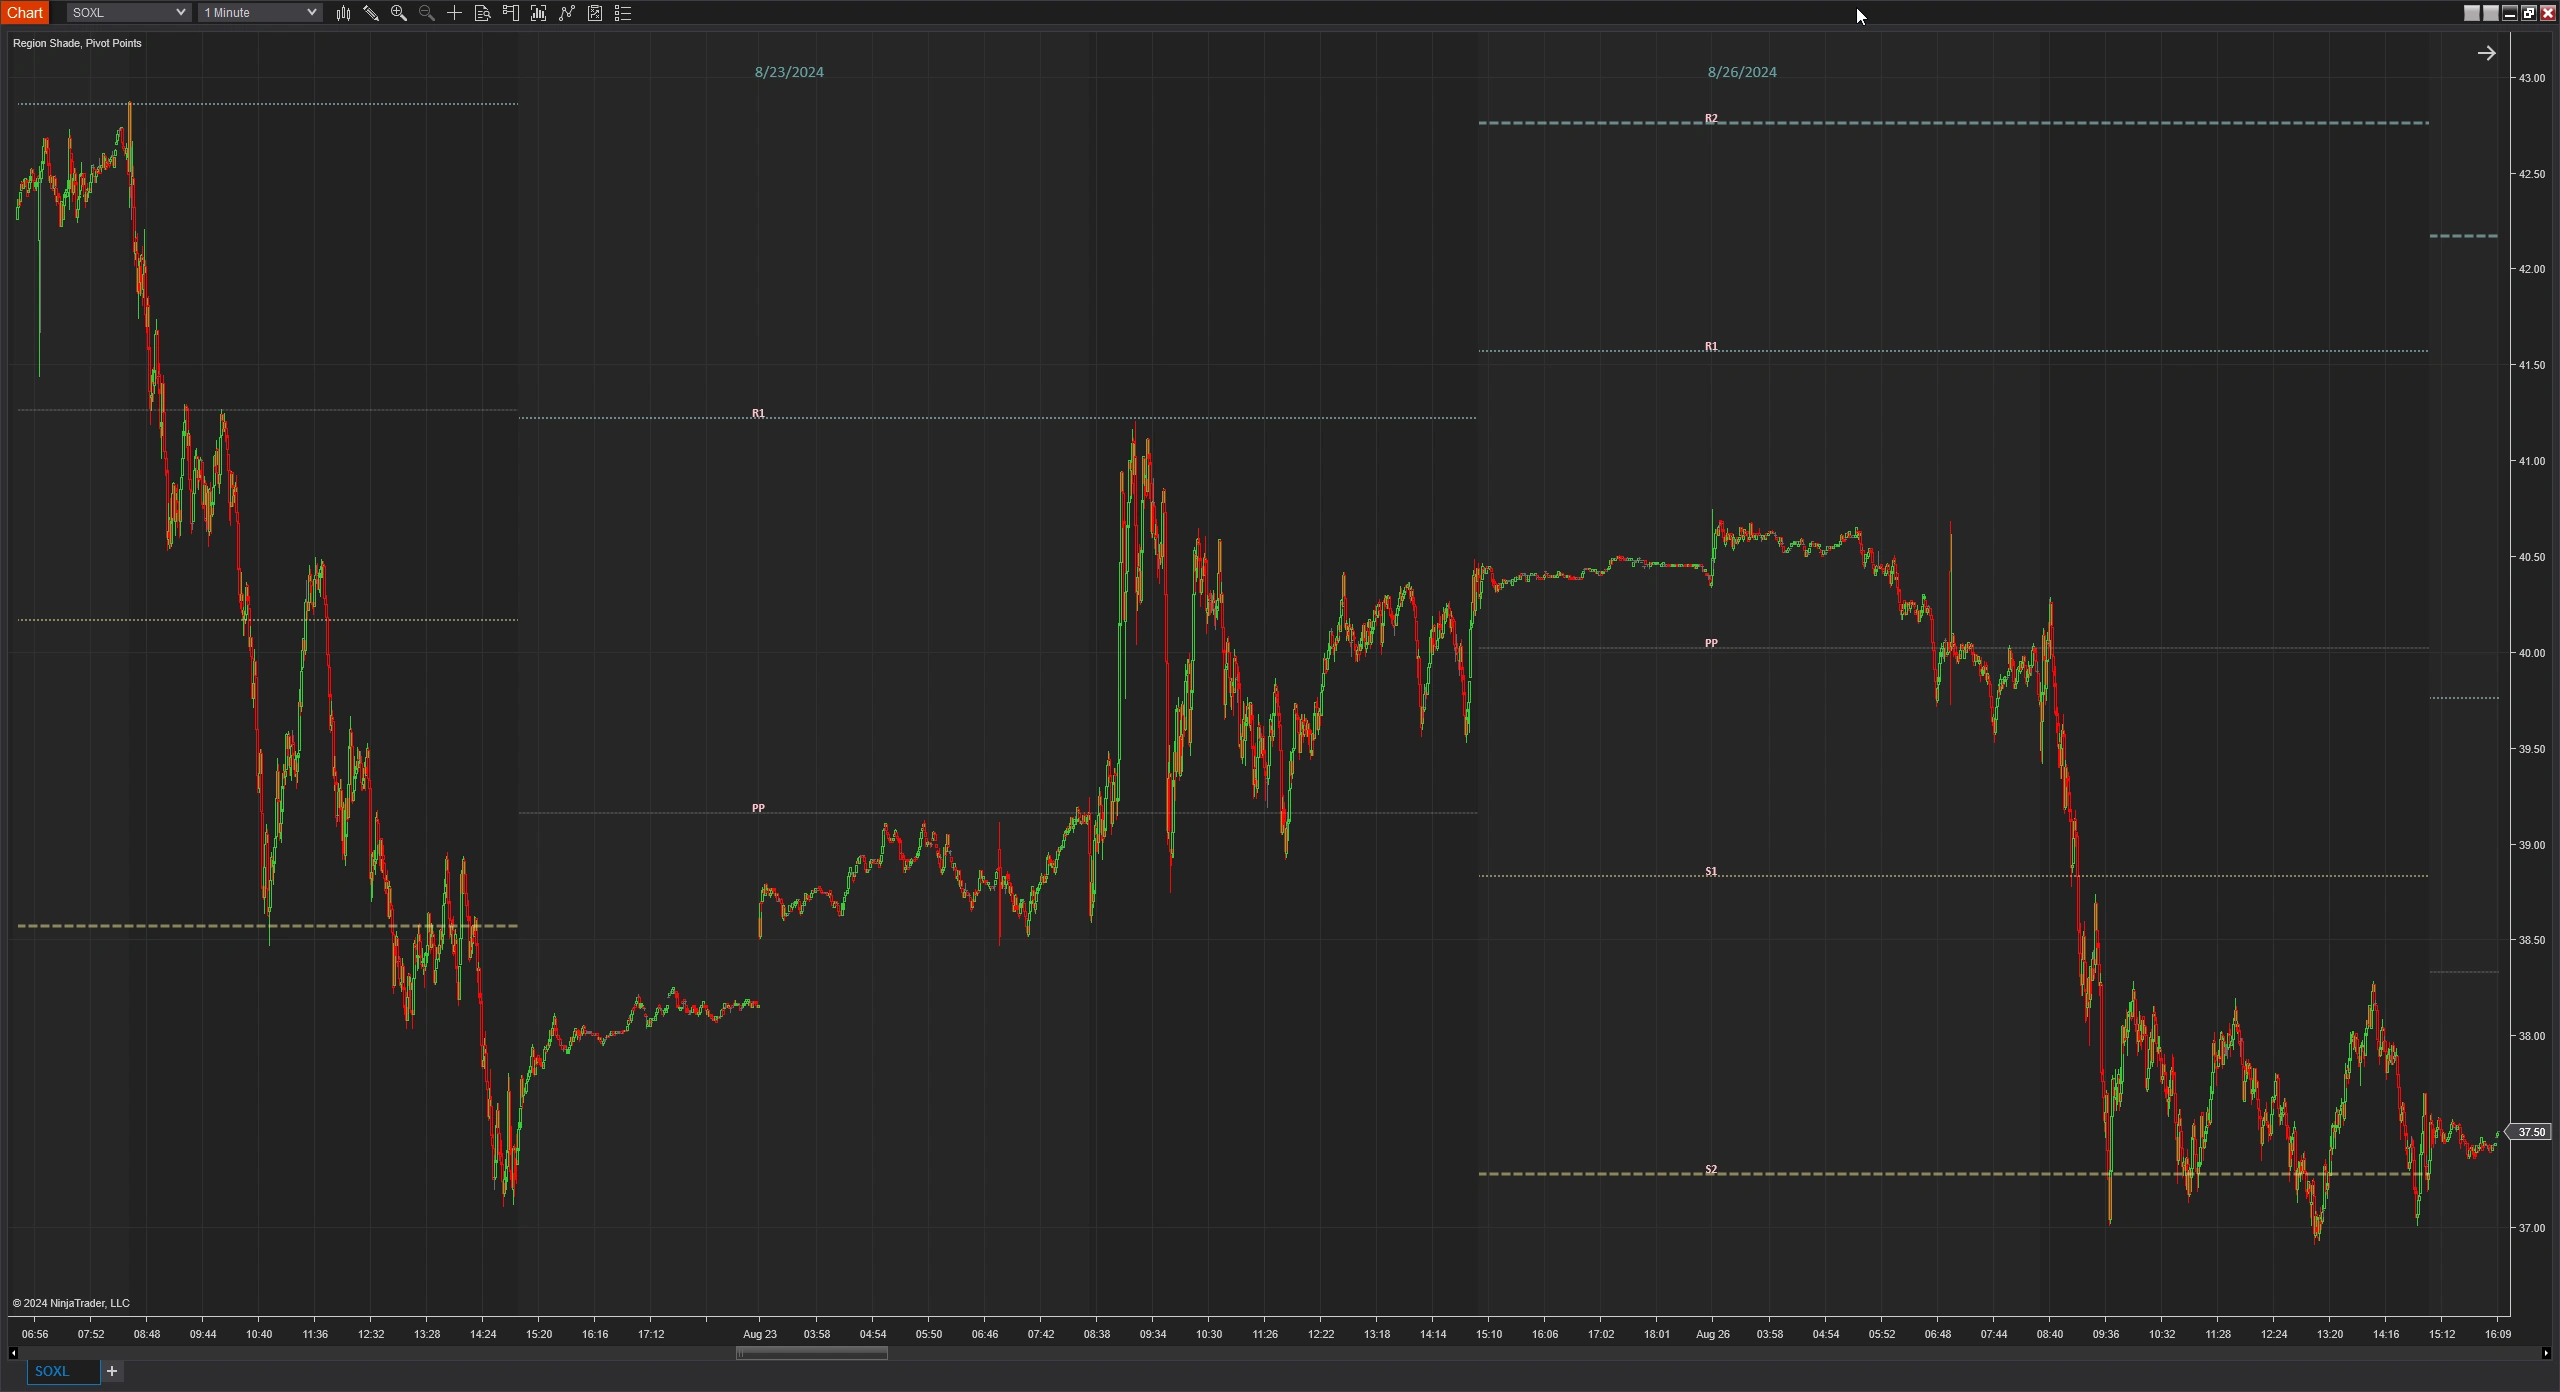
Features of the Standard Pivot Points Indicator
The standard Pivot Points indicator enhances trading by providing visual and customizable pivot levels on your chart. Here are some of its key features:
1. Custom Close Time
- Flexibility in Calculation: The indicator allows you to set a custom close time for calculating pivot points, not just relying on the standard market close time.
- Adaptability to Different Markets: This is especially useful for markets that operate outside standard trading hours or have unique closing times.
2. Display Options
- Selective Pivot Levels: You can choose which pivot levels to display on your chart:
- Pivot Point (PP)
- Support Levels (S1, S2)
- Resistance Levels (R1, R2)
- Show Historical Pivots: Option to display pivot points from previous sessions to analyze past market behavior.
3. Visual Customization
- Line Styles and Opacity: Customize the appearance of pivot lines by adjusting their style (solid, dashed, dotted), width, and opacity to match your chart preferences.
- Color Coding: Assign different colors to support and resistance levels for easy identification.
4. Labels
- Pivot Labels: Enable labels for each pivot level to display their names (e.g., "PP" for Pivot Point, "S1" for Support 1).
- Font Customization:
- Font Family: Choose from various font styles for the labels.
- Font Size: Adjust the size of the text for better readability.
- Bold Text: Option to display labels in bold for emphasis.
- Text Positioning:
- Pixel Displacement: Move the labels slightly up or down to prevent overlap with price bars or other chart elements.
- Text Opacity: Adjust the transparency of the text background for better visibility.
5. Line Opacity
- Adjustable Transparency: Change the opacity of the pivot lines to make them more or less prominent on your chart, helping you focus on the most critical levels.
Why Use the Standard Pivot Points Indicator?
- Simplicity: It provides clear and straightforward levels based on well-established calculations.
- Versatility: Applicable to various markets, including stocks, forex, and commodities.
- Immediate Insight: Quickly identify potential support and resistance levels without complex analysis.
- Customization: Tailor the indicator to your trading style and chart setup.
Tips for Trading with Pivot Points
- Combine with Other Analysis Tools: Use pivot points alongside other technical indicators like moving averages, trend lines, or oscillators to confirm signals.
- Monitor Price Action: Watch how the price behaves around pivot levels. Reversal patterns or strong momentum can provide additional clues.
- Be Aware of Market News: Economic announcements or significant news events can impact market sentiment and cause prices to move rapidly through pivot levels.
- Practice Good Risk Management: Always use stop-loss orders and manage your position sizes to protect your trading capital.
Review the screenshots and video for setup options.
Click here for a list of all of NinjaTrader's Downloads.
Screenshots
Media