
sharp vision traders
Enhancing Your Trading Experience

Money Flow Index (NT)
- Categories: Indicator, NinjaTrader
- Tags: Misc, Momentum, Oscillator, Volume
- Type: Free
The Money Flow Index (MFI) for NinjaTrader is a technical indicator that helps traders assess the strength of money flowing into and out of a financial instrument.
Note: This download requires NinjaTrader 8 release 8.1.3 or newer.
Understanding the Money Flow Index: A Guide for Traders
The Money Flow Index (MFI) for NinjaTrader is a technical indicator that helps traders assess the strength of money flowing into and out of a financial instrument. By combining price and volume data, the MFI provides insights into market momentum and potential reversal points. This guide will explain what the Money Flow Index is, how it works, and how traders can use it to make informed decisions.
What is the Money Flow Index?
The Money Flow Index is a momentum oscillator that measures the buying and selling pressure of an asset. It does this by analyzing both price movement and volume over a specified period. The MFI ranges between 0 and 100 and is used to identify overbought or oversold conditions in the market.
How is the Money Flow Index Calculated?
While the exact formula involves several steps, the core concept is straightforward:
- Typical Price Calculation: The typical price is calculated by adding the high, low, and close prices of a period and dividing by three.
- Money Flow: Multiply the typical price by the volume for that period to get the raw money flow.
- Positive and Negative Money Flow:
- Positive Money Flow: Sum of money flow on days when the typical price is higher than the previous period.
- Negative Money Flow: Sum of money flow on days when the typical price is lower than the previous period.
- Money Flow Ratio: Divide the positive money flow by the negative money flow.
- Money Flow Index Calculation: Apply the money flow ratio to a formula to get an index value between 0 and 100.
Interpreting the Money Flow Index
- Overbought Conditions (MFI above 80): When the MFI rises above 80, it suggests that the asset may be overbought, indicating a potential price reversal or pullback.
- Oversold Conditions (MFI below 20): When the MFI falls below 20, it indicates that the asset may be oversold, suggesting a potential upward price movement.
Features of the Money Flow Index Indicator
Based on the indicator implementation, here are some features that enhance its utility:
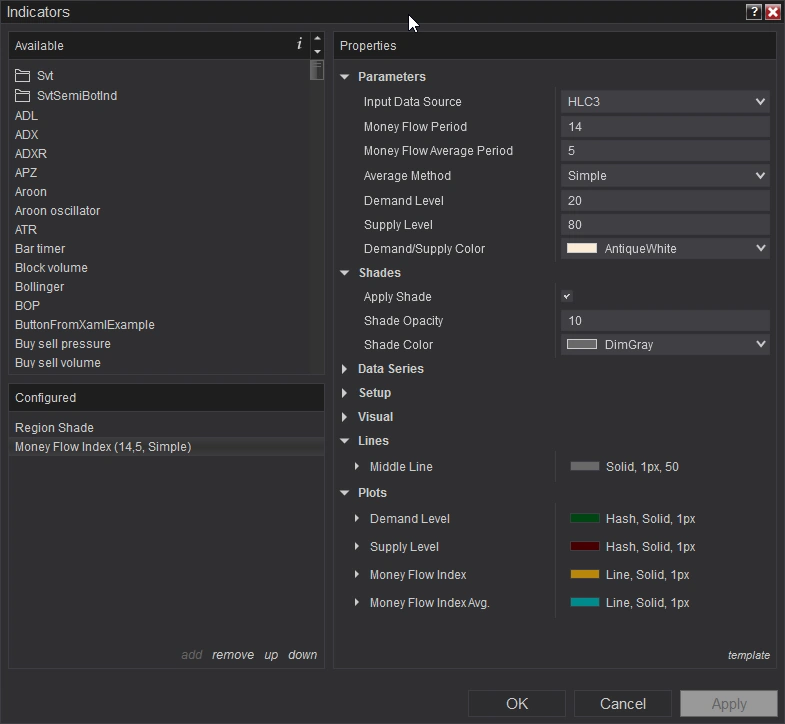
Customizable Parameters
- Input Data Source: Traders can choose different price inputs such as the typical price (average of high, low, and close), just the high price, low price, or other combinations to suit their analysis style.
- Money Flow Period: The period over which the MFI is calculated can be adjusted (commonly 14 periods), allowing traders to focus on short-term or long-term market movements.
- Average Period and Method: The indicator allows averaging the MFI over a specified period using different methods like Simple Moving Average (SMA), Exponential Moving Average (EMA), or others. This smoothing can help in identifying trends more clearly.
Visual Aids
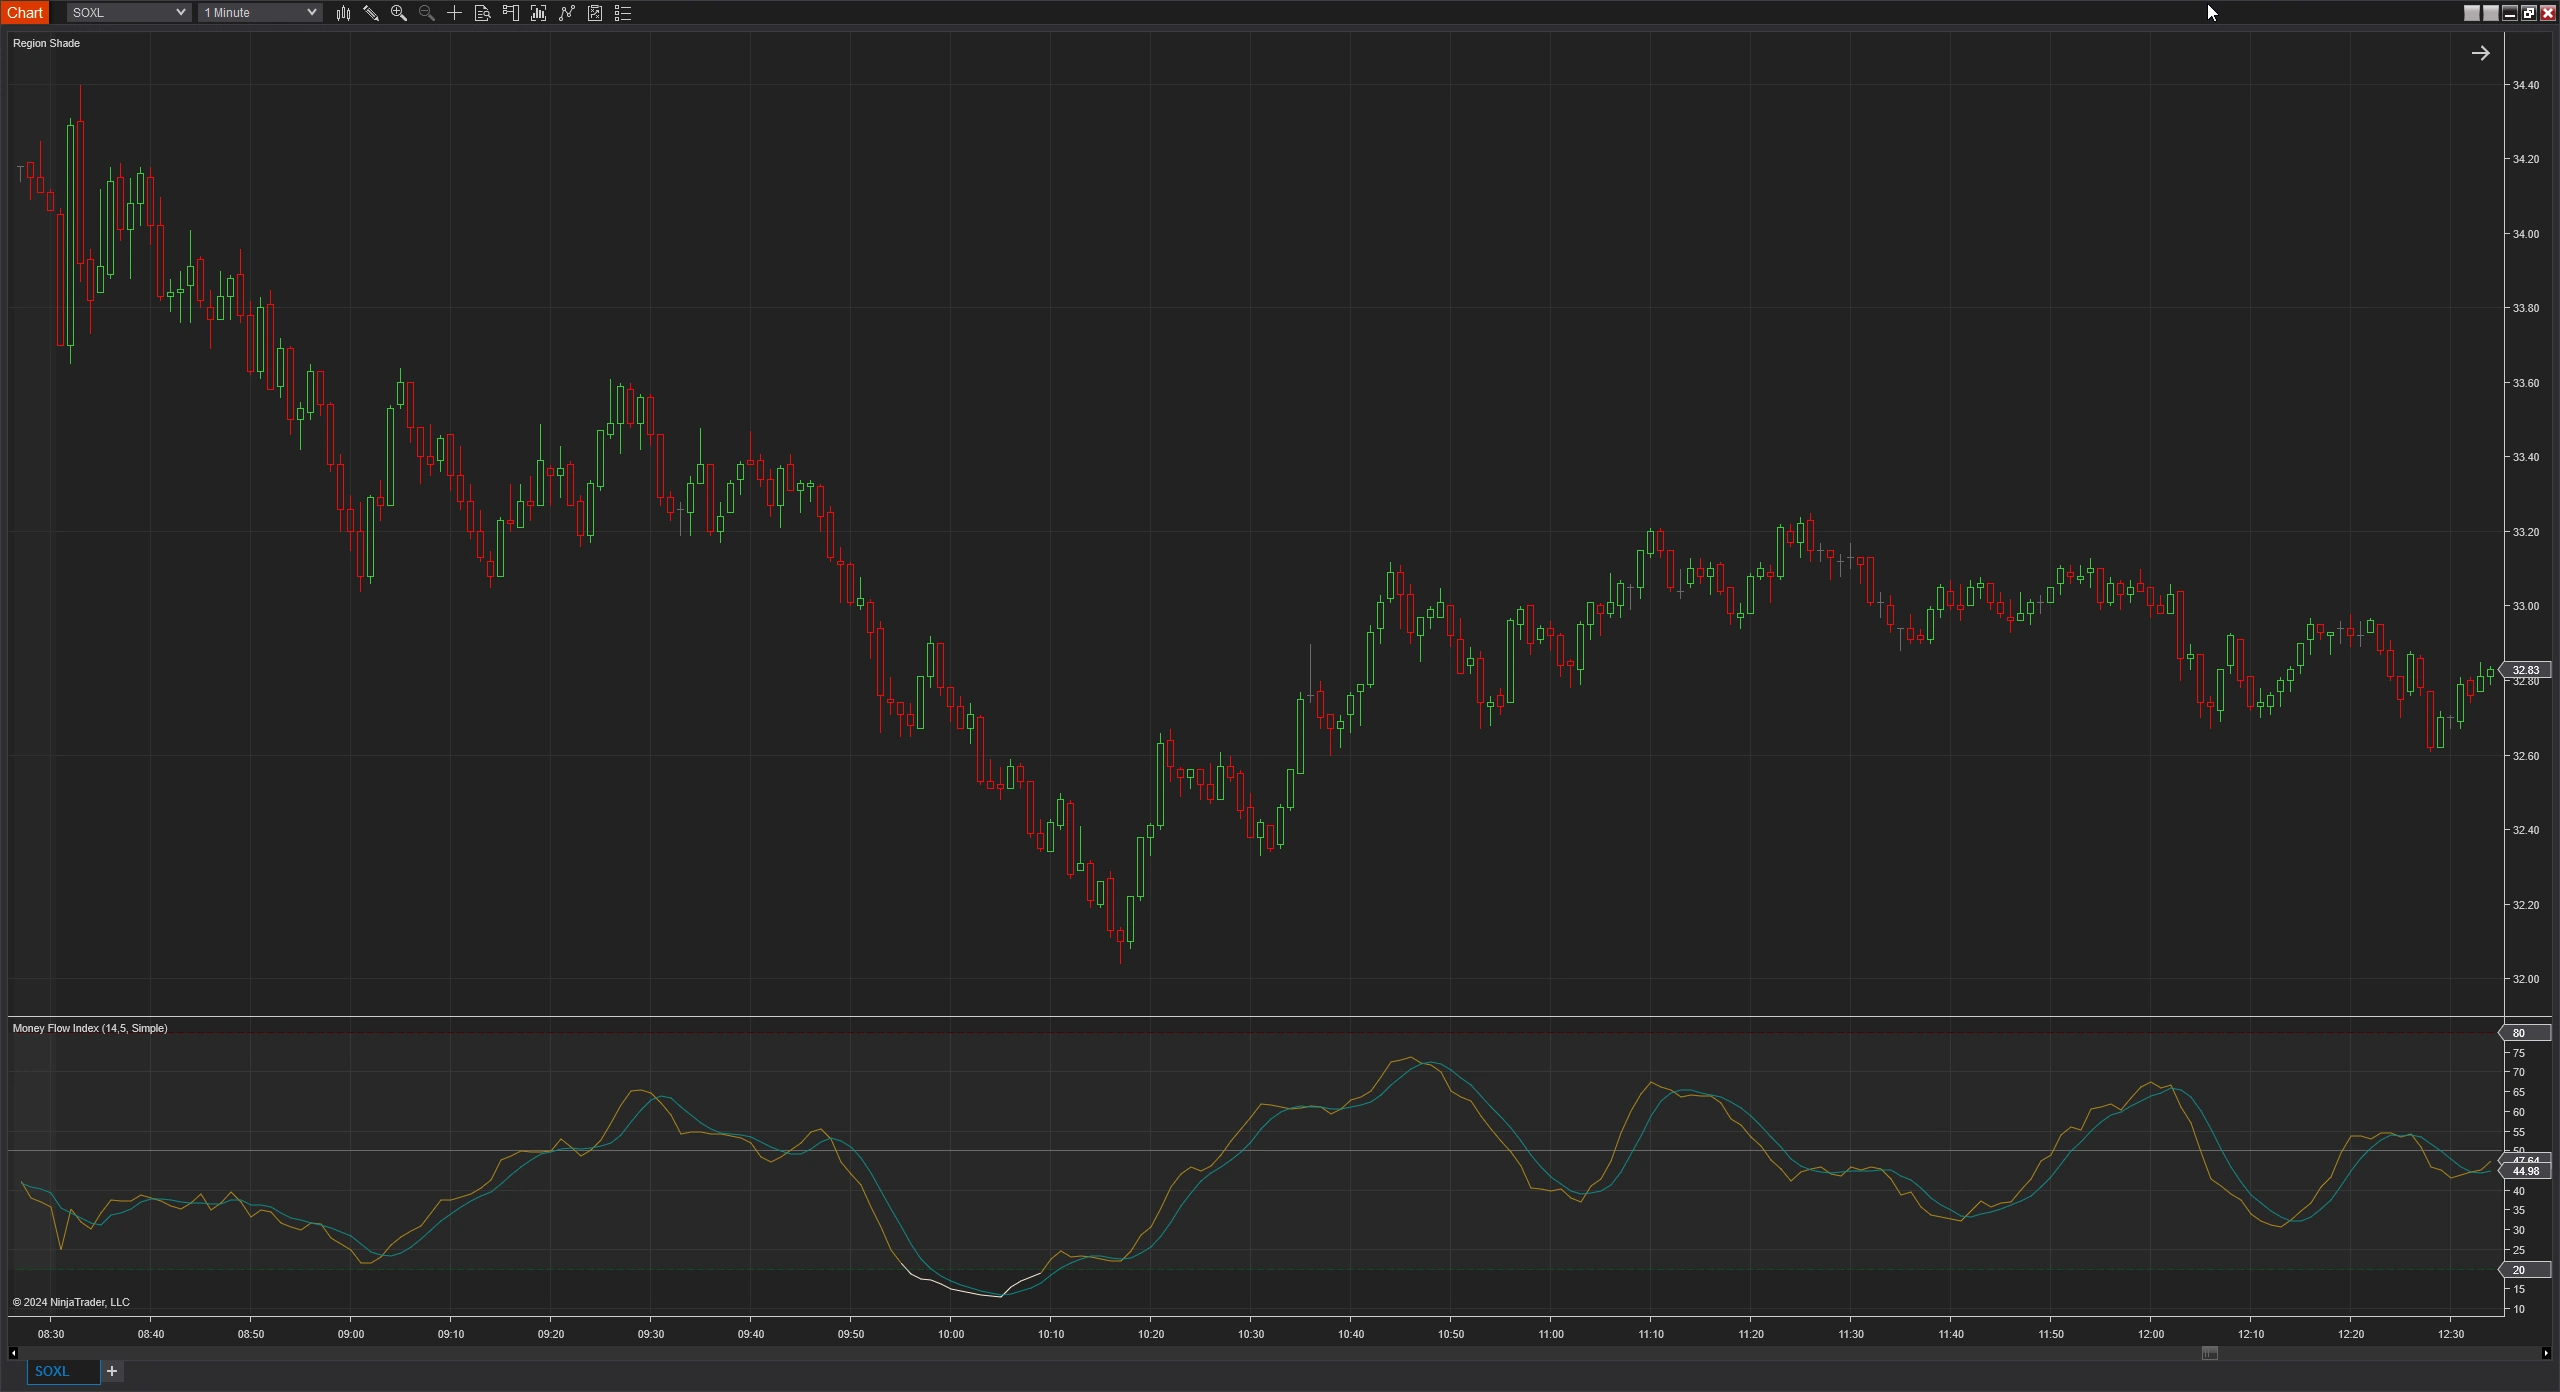
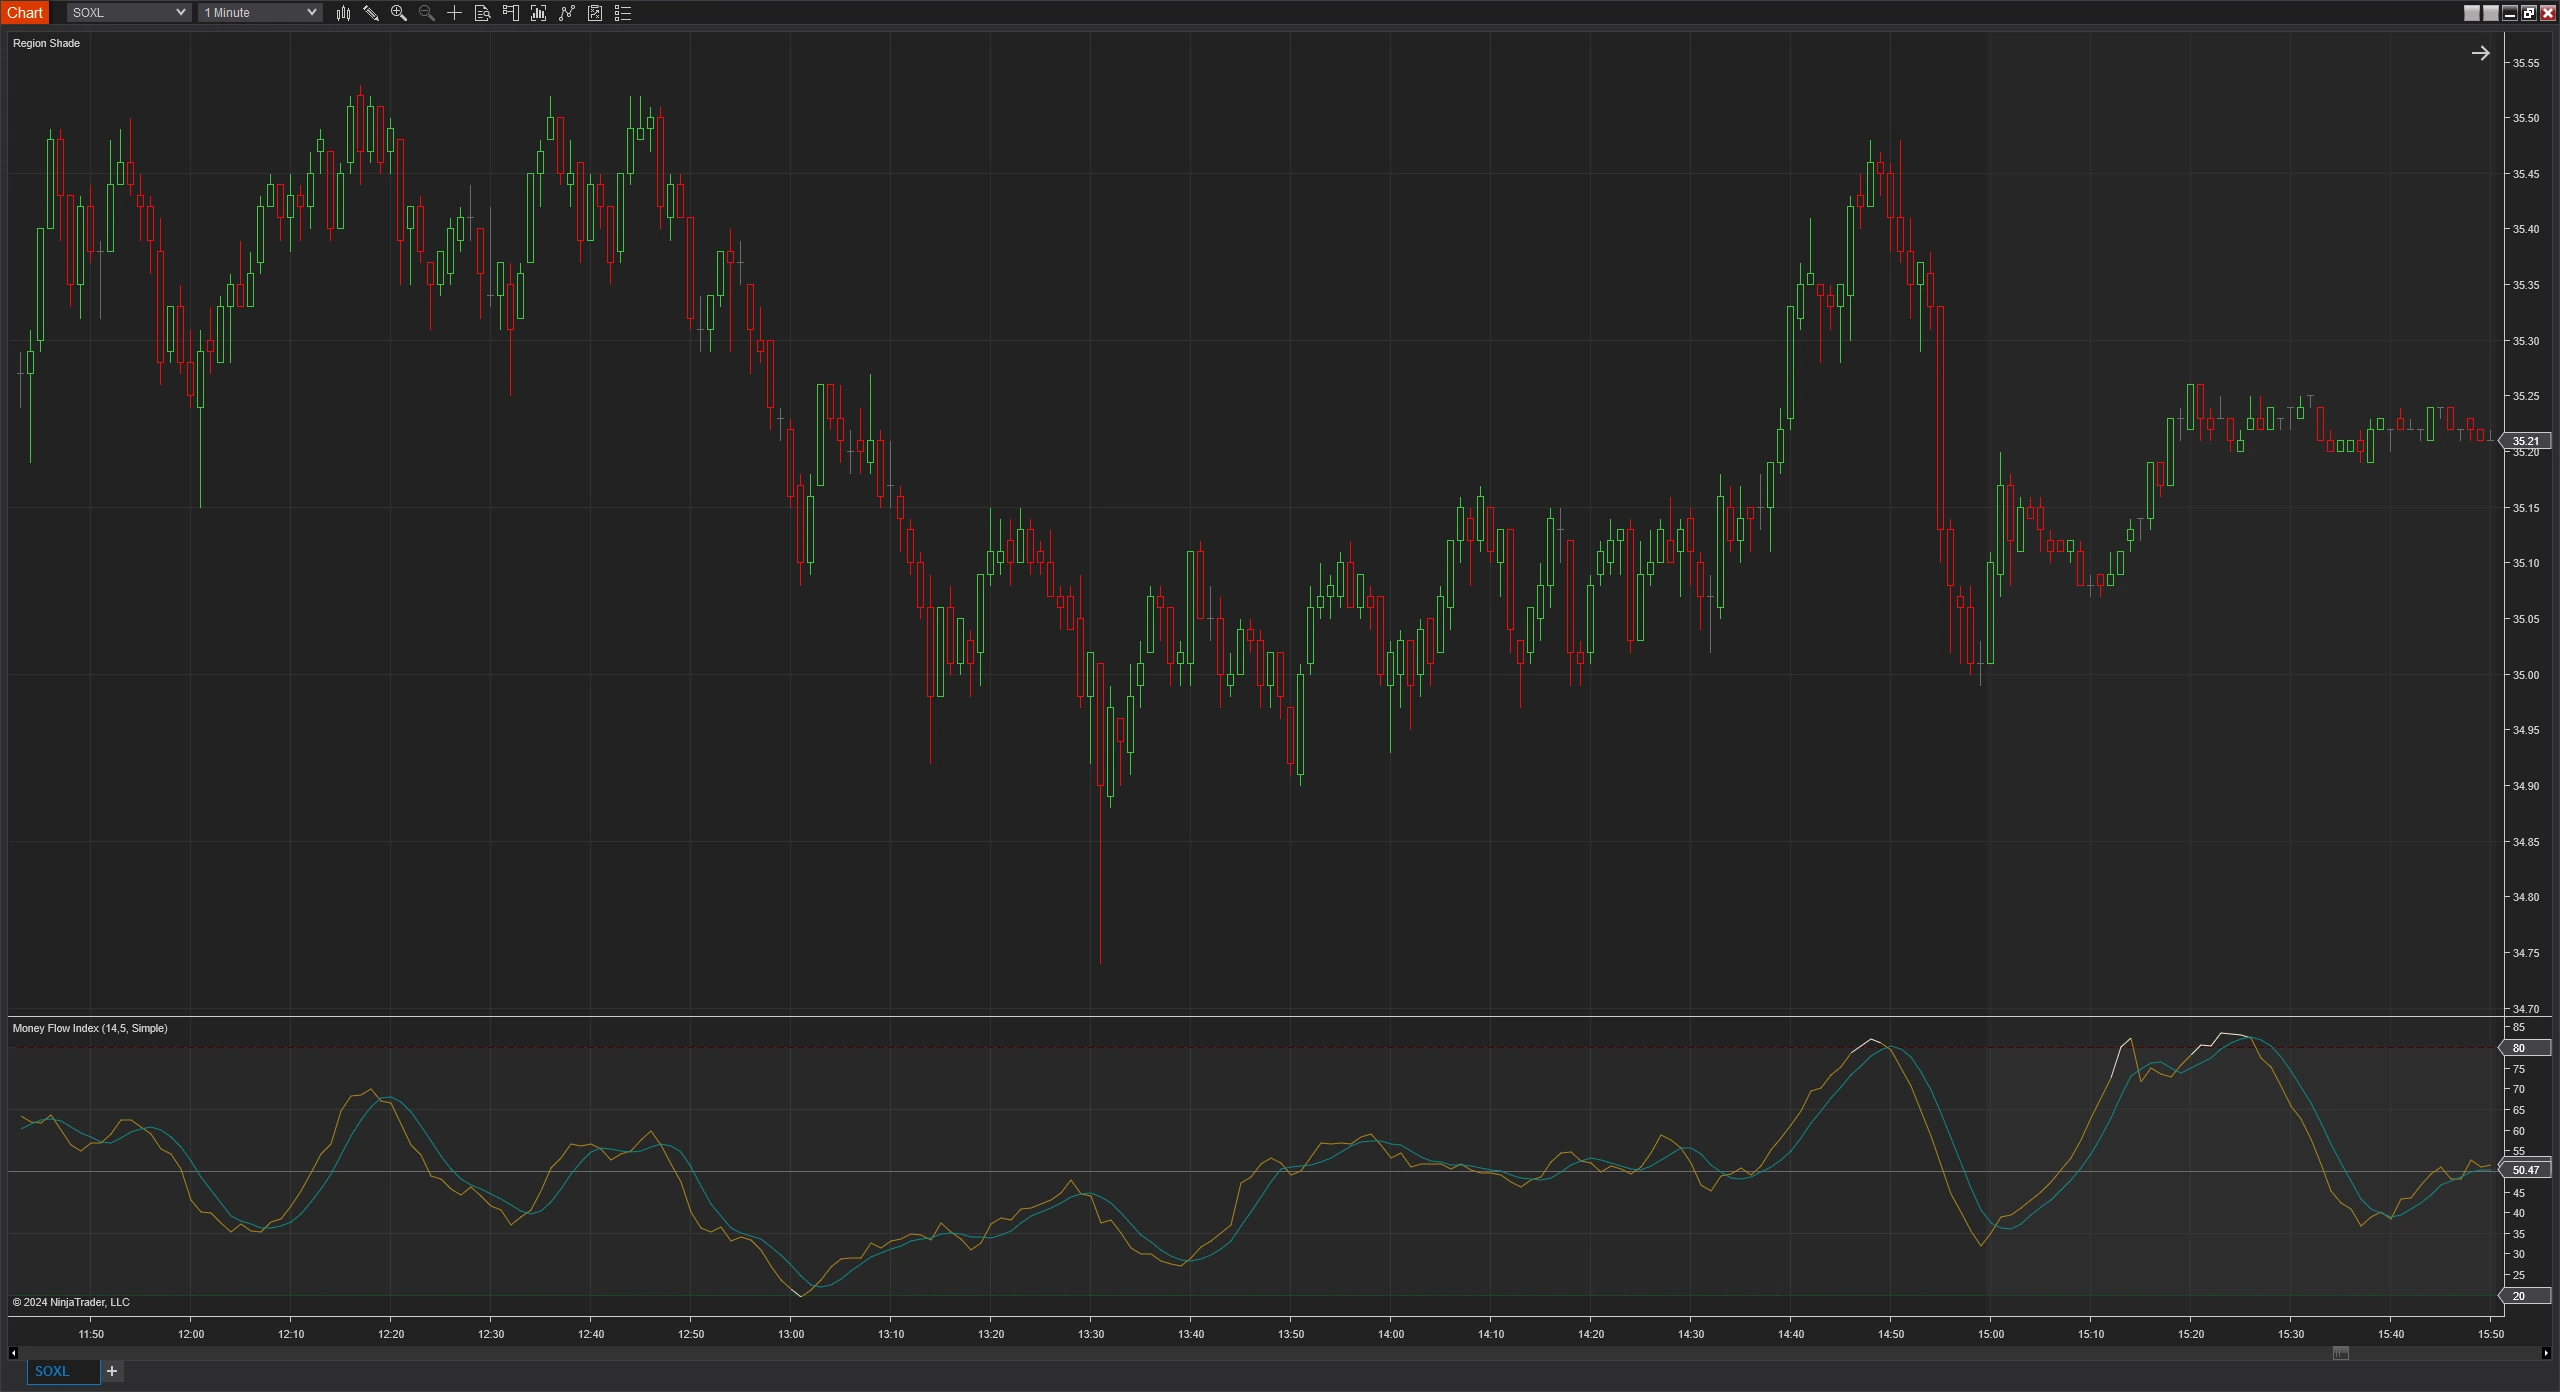
- Demand and Supply Levels: The indicator displays horizontal lines at the demand level (e.g., 20) and the supply level (e.g., 80), helping traders quickly identify overbought and oversold conditions.
- Shading Zones: Optional shading can be applied between the demand and supply levels on the chart. This visual highlight makes it easier to see when the MFI enters these critical zones.
- Color Coding: The MFI line can change color when entering the demand or supply zones, providing an immediate visual cue for potential trading signals.
Volume Consideration
- Volume Integration: The MFI incorporates volume directly into its calculation, unlike some other momentum indicators that use only price data. This inclusion provides a more comprehensive view of market activity.
Important Considerations
- Understand the Indicator: Before using the MFI for trading decisions, it's crucial to understand how it's calculated and what it represents. Knowing the underlying mechanics helps in interpreting signals correctly.
- Avoid Relying Solely on MFI: Like all technical indicators, the MFI is not infallible. It should be used as part of a broader trading strategy that includes other analysis tools and risk management practices.
- Adjust Parameters as Needed: Different assets and markets may respond better to different settings. Traders should experiment with the period lengths and averaging methods to find what works best for their specific context.
Review the screenshots for setup options.
Click here for a list of all of NinjaTrader's Downloads.
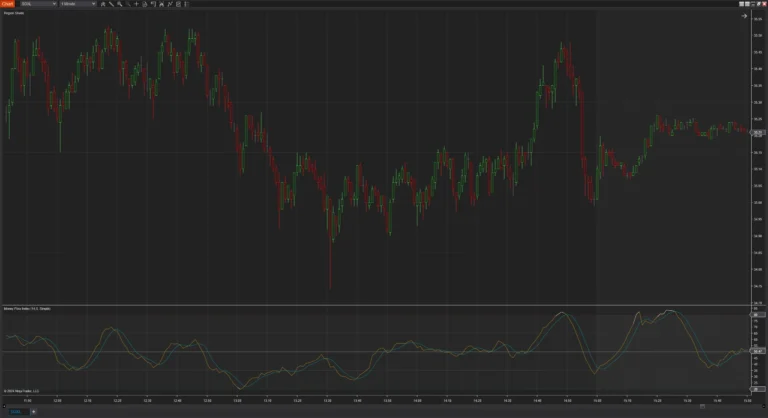
Screenshots
Media